Bibliometric Analysis of Published Literature on Taxation in Malaysia, Based on Scopus Database
- Hussaini Adamu Federal Polytechnic Kazaure, Jigawa State
- Tunku Puteri Intan Safinaz School of Accountancy, Universiti Utara Malaysia, Kedah
Journal of Business Management and Accounting 11(1) (2021) · https://doi.org/10.32890/jbma2021.11.1.4
Abstract
Taxation research has received considerable attention from many scholars, practitioners and policymakers across the globe. Many scholars have also conducted research on taxation in the Malaysian context. However, papers that track the trends of such research are scanty in the existing literature. The aim of this study is to review the trend and frequencies of published literature on taxation in Malaysia based on the Scopus database using the search term “Malaysia and tax†. The design of the study is bibliometric analysis. As of 23rd September 2020, a total of 88 documents were retrieved and analysed using Excel, Hazing’s Publish or Perish and VOSviewer software. Based on the standard bibliometric indicators, this paper reports the research papers and source types, years and language of publications, subject area, most active institutions, most active sources’ titles, keywords, authorship, abstract, title analysis and citation analysis. Findings revealed that there is an increase in growth rate of literature on studies related to taxation in the Malaysian context from 1977 to 2020 published in the Scopos database. The publications reached an all-time peak in 2016 to 2017 but significantly dropped in 2018 and 2019 based on the data retrieved from the Scopus database. The findings further show that Universiti Teknologi MARA is the most influential institution with 18.18% of the total documents retrieved, followed by Universiti Utara Malaysia with 9.1% respectively. Additional findings of the study show that Advance Science Letters is the highest source title with 14.71% of the published documents. The finding also indicates that Adhikari, Derashid and Zhang (2006) are the most influential authors with 187 citations as at 23rd September 2020. The research is limited to the literatures published in Scopus database, other database were not covered in this study. Malaysian policymakers should provide more research grants to tax practitioners and academicians to increase the level of publications in this field.
Keywords: Bibliometric analysis, taxation, Malaysia, scopus database
revenue. For instance, based on 2016 estimates, corporate tax, goods and services tax and individual income tax contributed 33.0%, 17.3% and 4.1% of overall government revenue respectively (Bank Negara, 2017). This data demonstrates the significance of taxation in the Malaysian economy which led to many scientific analyses of the impact of taxation on economic, political and social growth of Malaysia by several scholars. Moreover, a lot of studies have been conducted on taxation in the Malaysian context since 1977. However, analysis of the trend of such studies with a view to identifying the areas covered and not covered, the most influential authors in the field, the most influential journals that published such studies, the years with high or low publications, is rare in the existing literature. Thus, the central objective of this study is to review the trend and frequencies of published literatures on taxation in Malaysia, based on the Scopus database. This is with a view to identifying the areas covered and ignored, top Malaysian researchers and affiliated institutions with high publication in taxation, the language most used in tax publications in Malaysia and the most cited authors. This will enable identification of areas that needs improvement for potential researchers to investigate accordingly. The paper is organized as follows: the preceding section explains the objectives of the current study, section two covers more details on the purpose of bibliometric analysis and the concept. Section three describes the methodology used in the study. Section four provides details of the findings and finally, section five discusses the findings and concludes the study. LITERATURE REVIEW Bibliometric analysis is defined as a quantitative technique used in examining the development of a research field and knowledge structure based on the analysis of relevant and related publications (IGI Global, 2018). It is also defined by Pritchard (1969) as the application of statistics and mathematical approaches to articles, books and other medium of communications. Likewise, bibliometric analysis is considered as one of the popular methods in identifying the trend and movement of publications (Ahmi & Mohd Nasir, 2019). It is regarded as a quantitative approach using statistical apparatus to analyse information and texts as well as published documents from identified database (Hall, 2011; Daim et al., 2006). Additionally, bibliometric analysis is used in examining the quality and quantity of published information and to categorise the pattern and trends of a research domain (Sweileh et al., 2017). Equally, Ho (2007) describes bibliometric analysis as a quantitative tool that offers a descriptive analysis of published documents in a specific field, domain, period, country, or the combination of all. In their own contribution, Rusly et al. (2019) described bibliometric analysis as a logical approach in discovering more details regarding a published document which includes: frequency of keywords, authors’ information and citation analysis. It is pertinent to note that many indicators are used in bibliometric analysis: type of publication, publication outlets, authors’ affiliation, country where the documents originated and its h-index (Ahmi & Mohd Nasir, 2019). Thus, these indicators constitute the analysis tools based on the available data extracted from the chosen database. Other studies reported additional tools of analysis in their studies including citation per publication, citation counts, impact factor, impact per publication, co-authorship and co-citation (Ahmi, & Mohd Nasir, 2019). Moreover, it is important to note that, bibliometric analysis in the taxation field has received little attention. The few ones available are reviewed in this study. For instance, Zhou et al. (2020) conducted a bibliometric analysis related to researches on supply chain management under carbon tax. Additionally, Zhang, Wang, Liang and Chen (2016) categorized the carbon tax literature from 1989 to 2014 using bibliometric analysis from Web of Science database. The result shows that USA ranked highest in the carbon tax field and Vrije University was the most active institution. Additionally, da Fonseca and Juca (2020) conducted a bibiliometric analysis of the impact of taxes on foreign direct investment. The result shows that tax is a determinant for multinational companies investment decision. Furthermore, Nevzorova, Bobek, Kireenko and Sklyarov (2016) reviewed the literature relating to the problem of tax evasion using bibliometric analysis. The result indicates that the shadow economy and corruption are main contributors to tax evasion. However, with the current availability and accessibility of data for educational publications, various analytical tools have been developed for bibliometric data analysis. More importantly, the pattern of bibliometric analysis focused on visualising the bibliometric networks using VOSviewer software. Other analytical tools used to analyse the current research data will be discussed in the next section. METHODS The current study obtained data from the Scopus database as at 22nd September 2020. The reason for selecting the Scopus database is its reputation as the “major single abstract and indexing database ever built” (Burnham, 2006). More so, is the leading searchable citations as well as abstract searching literature (Chadegani et al., 2013). Moreover, the selected results were retrieved from the collections of documents such as documents type, sources type, year of publications, authors names, access type, subject area, affiliations and language used. This study focused only on taxation publications in Malaysia in the Scopus database as highlighted earlier. It is based on the titles of the documents hence the following search keywords was applied (Title (Malaysia and Tax). The keywords were chosen because they provide the researcher with quick access to the published literature related to taxation in Malaysia on the Scopus database. It is worthy of note that there are so many search key words in the Scopus database depending on the researcher’s preference. Such keywords includes Article Title, Abstract, Keywords, Authors, First Author, Source Title and Affiliation. In the case of this study, the author narrows the keywords to “Article Title, Abstract and Keywords” as mentioned above. Following the search keywords, a total of 88 documents were found. In view of the small number of documents found, the entire 88 documents were used for the analyses. Harzing Publish or Perish, Excel and VOS viewer software were used to analyse the results. RESULTS The data generated from the Scopus database was analysed to identify sources type, documents type, subject area, keywords, author counts, top nine cited articles, most influential institutions, most influential papers, citations metrics and the most productive authors. Thus, most of the findings are displayed as frequency and percentage for easy interpretation. For year of publication, a cumulative percentage was included to get the cumulative percentage of documents published each year. Document and Source Types The data analyses begin with documents types and source types. This is important to enable the reader to identify the documents and source types published in Scopus within a given period. The documents type includes articles, conference papers, book chapters and review while source types includes journals, conference proceedings, books and book series. It is worthy of note that the conference papers that appeared in documents types are, however, different from those found in other source types (Sweileh et al., 2017). Thus, under the documents type, conference papers are collections of papers presented in conferences and eventually published in journals as articles. Moreover, some conference papers were also published in either book chapters or conference proceedings although the original document type is the conference paper (Ahmi, Elbardan, & Ali, 2019). As stated at the beginning of this section, this study found only four types of documents: articles, conference paper, book chapter and reviews. Based on the result from Table 1, most of the publications were from articles, representing 80.68%, followed by conference papers with 12.59%. The smallest two types of document were book chapters and reviews with 5.68% and 1.14% respectively. However, Table 2 presents four source types. Journal has the highest percentage with 84%, followed by conferences proceedings with 10%. The two lowest contributions coincidently with the same percentage are books and book series with 3 % and 2% each, respectively.
| Document Type | Frequency | % (N=88) |
|---|---|---|
| Article | 71 | 80.68 |
| Conference Paper | 11 | 12.5 |
| Book Chapter | 5 | 5.68 |
| Review | 1 | 1.14 |
| Total | 88 | 100 |
| Source Type | Frequency | % (N=88) |
|---|---|---|
| Journals | 74 | 84.09 |
| Conference Proceedings | 9 | 10.23 |
| Books | 3 | 3.41 |
| Book Series | 2 | 2.27 |
| Total | 88 | 100 |
Evolution of Published Studies
The first taxation research in Malaysia was conducted in 1977 by Andic and published in a paper titled “Poverty and Tax Incidence in West Malaysia”. Afterwards, the level of publications witnessed a high rate of growth, especially from 2012 onwards as shown in Table 3 and
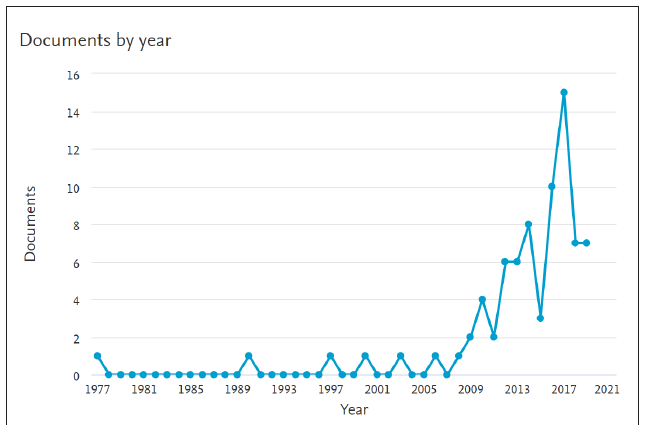
number of publications since 2012 although it declined in 2018 and 2019, which are the most recent years. The decline might be due to low submissions of Malaysian tax publications in Scopus journals. Hopefully, 2020 will be better since most of the academicians are aiming to publish in Scopus-indexed journals nowadays.
| Year | Frequency | % (N=88) | Cumulative Percentage |
|---|---|---|---|
| 1977 | 1 | 1.29 | 1.29 |
| 1990 | 1 | 1.29 | 2.59 |
| 1997 | 1 | 1.29 | 3.89 |
| 2000 | 1 | 1.29 | 5.19 |
| 2003 | 1 | 1.29 | 6.49 |
| 2006 | 1 | 1.29 | 7.79 |
| 2008 | 1 | 1.29 | 9.09 |
| 2009 | 2 | 2.59 | 11.68 |
| 2010 | 4 | 5.19 | 16.88 |
| 2011 | 2 | 2.59 | 19.48 |
| 2012 | 6 | 7.79 | 27.27 (continued) |
| Year | Frequency | % (N=88) | Cumulative Percentage |
| 2013 | 6 | 7.79 | 35.06 |
| 2014 | 8 | 10.38 | 45.45 |
| 2015 | 3 | 3.89 | 49.35 |
| 2016 | 10 | 12.98 | 62.33 |
| 2017 | 15 | 19.48 | 81.81 |
| 2018 | 8 | 9.09 | 90.90 |
| 2019 | 8 | 9.09 | 90.90 |
| 2020 | 9 | 10.22 | 100 |
| Total | 88 | 100 |
The language found to be most frequently used to publish tax researches in Malaysia based on the Languages of Documents search term “Malaysia and tax” in the Scopus database is English language. As shown in Table 4, 98.7% of the tax researches in Malaysia were published in English language. Only 1.3%, representing one publication out of 88 taxation research found in Scopus database, were published in Bahasa The language found Melayu as at 23rd September 2020.to be most frequently used to publish tax researches in Malaysia based on the search term “Malaysia and tax” in the Scopus database is English language. As shown in Table 4, Languages Used for Publications 98.7% of the tax researches in Malaysia were published in English Language Only 1.3%, Frequency % (N= 88)of 88 taxation language. representing one publication out 98.70 English research in Bahasa Melayu 1 database, were published1.29 Malay found in Scopus Total as at 23rd September 2020.
| Languages Used for Publications | |||
|---|---|---|---|
| 98.7% of the tax researches in Malaysia were published in English | |||
| language. | |||
| Language Only 1.3%, | representing one publication | ||
| Frequency | out | ||
| % (N= | 88)of 88 taxation | ||
| English | 87 | 98.70 | |
| research | |||
| Malay found in Scopus | 1 database, were published1.29 in Bahasa Melayu | ||
| as at 23rd September 2020. | |||
| Total | 88 | 100 | |
The report from the generated data provides subject areas covered by the published taxation researches in Malaysia from the Scopus database. Results from Table 5 indicated that most of the taxation studies in Malaysia are in the area of Business, Management and Accounting with about 37 publication equivalent to 23.5%. This is followed by Economics, Econometrics and Finance with a
| Languages Used for Publications | |||
|---|---|---|---|
| 98.7% of the tax researches in Malaysia were published in English | |||
| language. | |||
| Language Only 1.3%, | representing one publication | ||
| Frequency | out | ||
| % (N= | 88)of 88 taxation | ||
| English | 87 | 98.70 | |
| research | |||
| Malay found in Scopus | 1 database, were published1.29 in Bahasa Melayu | ||
| as at 23rd September 2020. | |||
| Total | 88 | 100 | |
Subject Area
The report from the generated data provides subject areas covered by the published taxation researches in Malaysia from the Scopus database. Results from Table 5 indicated that most of the taxation studies in Malaysia are in the area of Business, Management and Accounting with about 37 publication equivalent to 23.5%. This is followed by Economics, Econometrics and Finance with a total of 35 publications amounting to 22.3%. The next area with high publications is Social Sciences with 26 publications equivalent to 16.6%. The fourth area with high publications is Computer Science with 14 publications equivalent to 9% of the total published papers related to taxation in Malaysia in the Scopus database.
| Subject Area | Frequency | % (N=157) |
|---|---|---|
| Agricultural and Biological Sciences | 1 | 0.63 |
| Arts and Humanities | 4 | 2.54 |
| Business, Management and Accounting | 37 | 23.56 |
| Computer Science | 14 | 8.91 |
| Decision Sciences | 8 | 5.09 |
| Economics, Econometrics and Finance | 35 | 22.29 |
| Energy | 6 | 3.82 |
| Engineering | 8 | 5.09 |
| Environmental Science | 8 | 5.09 |
| Mathematics | 5 | 3.18 |
| Medicine | 2 | 1.27 |
| Multidisciplinary | 2 | 1.27 |
| Pharmacology, Toxicology and Pharmaceutics | 1 | 0.63 |
| Social Sciences | 26 | 16.56 |
| Total | 157 | 100 |
Most Active Source Titles with Minimum of Two Articles
The result from the data extracted provided the most active source titles used by scholars to publish taxation-related researches in the Scopus database in the Malaysian context. Results from Table 6 show that “Advanced Science Letters” has the highest number of 5 published articles equivalent to 14% of the total 34 publications. This is followed by “International Journal of Supply Chain Management”, “International Review of Management and Marketing” and “Journal of Financial Crime” with three published articles respectively. The remaining Journals published only two articles each.
| Source Title | Frequency % (N=34) | |
|---|---|---|
| Advanced Science Letters | 5 | 14.70 |
| International Journal of Supply Chain | 3 | 8.82 |
| Management | ||
| International Review of Management and | 3 | 8.82 |
| Marketing | ||
| Journal of Financial Crime | 3 | 8.82 |
| Asian Review of Accounting | 2 | 5.88 |
| Australian Journal of Basic and Applied | 2 | 5.88 |
| Sciences | ||
| Ejournal Of Tax Research | 2 | 5.88 |
| International Journal of Economic Perspectives | 2 | 5.88 |
| International Journal of Economic Research | 2 | 5.88 |
| Isbeia 2012 IEEE Symposium on Business | 2 | 5.88 |
| Engineering and Industrial Applications | ||
| Jurnal Ekonomi Malaysia | 2 | 5.88 |
| Jurnal Pengurusan | 2 | 5.88 |
| Pertanika Journal of Social Science and | 2 | 5.88 |
| Humanities | ||
| Pertanika Journal of Social Sciences and | 2 | 5.88 |
| Humanities | ||
| Total | 34 | 100 |
Total
Keywords Analysis
This section presents author keywords in both table and visual forms. The author keywords were generated from VOSviewer software as pointed earlier in the introductry part of section three. VOSviewer is a software tool that aids in constructing and visualizing bibliometric networks (Aidi et al., 2019). Results from Figure 2 depicts a network visualization of authors’ keywords. Thickness of connecting lines, square size and colour were used to depict the relationships with other keywords. For instance, keywords with the same colour were listed together. Based on Figure 2, for example, taxation, economic growth and tax revenue have a similar colour (green). Confirmation, goods and services tax and awareness have similar colour (red). This indicates that these groups of keywords are commonly used in one study. Results from Table 7 indicates that “Malaysia” was used frequently as keyword in these studies, because it has the highest percentage of 33% approximately, followed by “Taxation” with 16.5 respectively.
| Keywords | Frequency | % (N=85) |
|---|---|---|
| Malaysia | 28 | 32.94 |
| Taxation | 14 | 16.47 |
| Awareness | 5 | 5.88 |
| Economics | 5 | 5.88 |
| Tax Compliance | 5 | 5.88 |
| Attitude | 4 | 4.70 |
| Corporate Governance | 4 | 4.70 |
| Goods and Services Tax | 4 | 4.70 |
| Income Tax | 4 | 4.70 |
| Tax Evasion | 4 | 4.70 |
| Tax Knowledge | 4 | 4.70 |
| Tax Revenue | 4 | 4.70 |
| Total | 85 | 100 |
| Figure |
Authorship
Table 8 presents authors’ relationships with the published documents. These include the number of authors as well as the number of documents published by those authors from 1977 to 2020. The table present the level of collaboration by some group of authors to published certain numbers of documents as well as the number of single authors published documents. For example, a total of three authors published 56 documents together representing 30.10% of the total 88 documents. Additionally, a total of two authors jointly published 38 documents representing 20.43% of the total 88 documents while a total of nine documents were published by single authors representing 4.83%.
| Author Count | Frequency | % (N=186) |
|---|---|---|
| 3 | 56 | 30.10 |
| 2 | 38 | 20.43 |
| 2 | 31 | 16.66 |
| 1 | 9 | 4.83 |
| 2 | 6 | 3.22 |
| 1 | 5 | 2.68 |
| 3 | 4 | 2.15 |
| 4 | 3 | 1.61 |
| 2 | 3 | 1.61 |
| 3 | 3 | 1.61 |
| 1 | 3 | 1.61 |
| 1 | 3 | 1.61 |
| 2 | 2 | 1.07 |
| 2 | 2 | 1.07 |
| 2 | 2 | 1.07 |
| 2 | 3 | 1.61 |
| 4 | 2 | 1.07 |
| 4 | 1 | 0.53 |
| 3 | 1 | 0.53 |
| 4 | 1 | 0.53 |
| 3 | 1 | 0.53 |
| 3 | 1 | 0.53 (continued) |
| Author Count | Frequency | % (N=186) |
| 3 | 1 | 0.53 |
| 3 | 1 | 0.53 |
| 3 | 1 | 0.53 |
| 4 | 1 | 0.53 |
| 2 | 1 | 0.53 |
| 2 | 1 186 | 0.53 100 |
Figure 3 below presents network visualization of co-authorship using fractional counting based on a minimum of one document per author and at least minimum of two citations per author. Fractional counting is a calculation made by the VOSviewer software based on the user instructions. This analysis indicates scholar’s co-authorship with minimum number of one document and two citations. It means any co-authorship with less than two citations are fractionally excluded by the software. The result is presented in colour and thickness line, which shows some clusters of authors with co-authorship. For instance, the red colour potrayed number of co-authorship with at least one number of documents and two citations. The yellow colour indicates co-authorship with at least two number of documents and two citations. The blue color also potrayed co-authorship with at least three number of documants and more than two citations. The green color depicts co-authorship with more than three documents and more than two citations.
Minimum number of documents of an author = 1 Minimum number of citations of an author = 2
The figure itself is in the PDF version.
4 below presents visualization of the co-occurrence network Text Analysis based on title and abstract fields (Full Counting). This analysis Figure 4 below presents visualization of the co-occurrence network based on title and abstract fields shows the most frequently used wordsusedinwords the intitle and of the (Full Counting). This analysis shows the most frequently the title andabstracts abstracts of the selected documents based on Full Counting. Full Counting is done by the VOSviewer software based selected documents based on Fullbetween Counting. Counting on user instruction. The coloured line interwoven one clusterFull and another indicatesisthedone interconnections of the words in the titles and based abstracts of selectedinstruction. documents. by the VOSviewer software ontheuser The coloured line interwoven between one cluster and another indicates the interconnections of the words in the titles and abstracts of the selected documents.
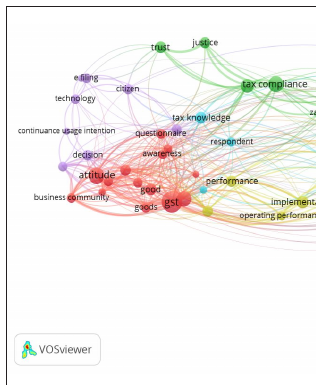
Figure 5 below shows the visualization of a term co-occurrence network based on title fields (Binary Counting). Binary Counting is usually performed by the VOSviewer software based on the user instruction. The interwoven colored lines between the three clusters highlights the network of some words which were frequently used in the titles of the selected documents.
Figure 5 below shows the visualization of a term co-occurrence network based on title fields (Binary Counting). Binary Counting is usually performed by the VOSviewer software based on the user instruction. The interwoven colored lines between the three clusters highlights the network of some words which were frequently used in the titles of the selected documents.
Figure 5. VOSviewer visualization of a term co-occurrence network based on title fields (Binary Figure 5. VOSviewer visualization of a term co-occurrence network Counting)
based on title fields (Binary Counting)
Most Influential Institutions
This section presents the frequencies and the percentage of the most influential institutions with at least twoInfluential taxation related publications in the Malaysian context and published in the Scopus database. Most Institutions Based on Table 9, Universiti Teknologi MARA has the highest publications related to taxation in the Malaysian context published in the Scopus database with 20 publications equivalent to 22.73% out of 88 publications selected. This is followed by Universiti Utara Malaysia with 14 publications and Universiti Malaya with 9 publications. The institutions with lowest publications are University of Leeds, Monash University, Vilniaus Gedimino Technikos Universitetas, Universiti Tunku Abdul Rahman and Leeds University Business School with two publications each.
This section presents the frequencies and the percentage of the most influential institutions with at least two taxation related publications in the Malaysian context and published in the Scopus database. Based
| Most Influential Institutions with Minimum of Two Publications | |
|---|---|
| related to taxation in the Malaysian context published in the Scopus | |
| database | |
| Institutions | |
| with 20 publications Frequency | equivalent to 22.73% out of 88 % (N=88) |
| publications | |
| Universiti Teknologiselected. | |
| MARA This is followed | 20 by Universiti 22.73 Utara Malaysia |
| Universiti Utara Malaysia | 14 15.90 |
| with 14 publications | |
| University of Malaya and | Universiti 9 Malaya with 10.23 9 publications. The |
| institutions with lowest publications | |
| Universiti Putra Malaysia | |
| International Islamic University Malaysia | are University 7.95 7.95 of Leeds, Monash |
Most Influential Institutions with Minimum of Two Publications related to taxation in the Malaysian context published in the Scopus database with 20 publications Frequency equivalent to 22.73% out of 88 Institutions % (N=88) Universiti Teknologi MARA 22.73 publications selected. This is followed by Universiti Utara Malaysia Universiti Utara Malaysia 15.90 with publications and Universiti Malaya with publications. The University of Malaya 10.23 Universiti Putra Malaysia 7.95 institutions with lowest publications are University of Leeds, Monash International Islamic University Malaysia 7.95 University, Vilniaus Gedimino Technikos Universitetas, Universiti Tunku Abdul Rahman and Leeds University Business School with two publications each.
| Most Influential Institutions with Minimum of Two Publications | |
|---|---|
| related to taxation in the Malaysian context published in the Scopus | |
| database | |
| Institutions | |
| with 20 publications Frequency | equivalent to 22.73% out of 88 % (N=88) |
| publications | |
| Universiti Teknologiselected. | |
| MARA This is followed | 20 by Universiti 22.73 Utara Malaysia |
| Universiti Utara Malaysia | 14 15.90 |
| with 14 publications | |
| University of Malaya and | Universiti 9 Malaya with 10.23 9 publications. The |
| institutions with lowest publications | |
| Universiti Putra Malaysia | |
| International Islamic University Malaysia | are University 7.95 7.95 of Leeds, Monash |
Citation Analysis
This study used the Harzing’s Publish or Perish software to obtain the citation metrics of the retrieved documents. The data generated from the Scopus database was imported into the software to generate the citation metrics together with the total citations of each document. Table 10 provide a summary of the citation metrics for the document as at 19th January 2020. The summary comprises of the publication years which started from 1977-2019, the total citations of the entire documents between 1977-2019, number of papers published within the period, citations years, citations per year, citations per paper, authors per paper, h-index, g-index, h-normal and h-annual.
| Metrics | Data |
|---|---|
| Publication years | 1977-2020 |
| Citation years | 43 (1977-2020) |
| Papers | 88 (continued) |
| Metrics | Data |
| Citations | 535 |
| Citations/year | 12.44 |
| Citations/paper | 6.08 |
| Authors/paper | 3.24 |
| h-index | 9 |
| g-index | 22 |
| hi norm | 6 |
| hi annual | 0.14 |
Nine most influential articles related to taxation in the Malaysian context published in the Scopus database are presented in Table 11 The article with the highest citation entitled “Public policy, political connections, and effective tax rates: Longitudinal evidence from Malaysia” by Adhikari, Derashid and Zhang (2006) received a total of 187 citations as at 23rd September 2020 with 13.36 citations per year, followed by Malpezzi and Mayo (1997) with 82 total citations and 3.57 citations per year followed by the remaining seven publications.
| No. Authors | Article Title | Year Cites | Cites | ||
|---|---|---|---|---|---|
| per | |||||
| Year | |||||
| 1 | A. Adhikari, C. Derashid, H. Zhang | Public policy, political connections, and effective tax rates: Longitudinal evidence from Malaysia | 2006 | 187 | 13.36 |
| 2 | S. Malpezzi, S.K. Mayo | Getting housing incentives right: A case study of the effects of regulation, taxes, and subsidies on housing supply in Malaysia | 1997 | 82 | 3.57 |
| 3 | C. Derashid, H. Zhang | Effective tax rates and the “industrial policy” hypothesis: Evidence from Malaysia | 2003 | 68 | 4.00 |
| 4 | R. Hussein, N. Mohamed, A.R. Ahlan, M. Mahmud, U. Aditiawarman No. Authors | An integrated model on online tax adoption in Malaysia Article Title | 2010 Year Cites | 17 | 1.70 (continued) Cites per Year |
| 5 | T. Santhanamery, T. Ramayah | Explaining the e-Government 2014 usage using expectation confirmation model: The case of electronic tax filing in Malaysia | 17 | 2 | |
| 6 | N.A. Mohd Yusof, | Tax non-compliance among 2014 L.M. Ling, Y.B. Wah SMCs in Malaysia: Tax audit evidence | 17 | 2.83 | |
| 7 | M. Dorasamy, M. Marimuthu, M. Raman, M. Kaliannan | E-government services online: An exploratory study on tax e-filing in malaysia | 2010 | 13 | 1.30 |
| 8 | S. Narayanan | The impact of the goods and services tax (GST) in Malaysia: Lessons from experiences elsewhere (A Note) | 2014 9 | 1.50 | |
| 9 | E.A.A. Wahab, A.M. Ariff, M.M. Marzuki, Z.M. Sanusi | Political connections, corporate governance, and tax aggressiveness in Malaysia | 2017 16 | 5.33 | |
DISCUSSION/CONCLUSIONS
The aim of this study is to review the trend and frequencies of published literatures on taxation in Malaysia based on the Scopus database. The study found 88 documents as at 23rd September 2020 from the Scopus database using a defined search keywords as pointed earlier. The results from the analysed data includes document types, source types, year of publications, language of documents, subject area, most active source titles, keywords analyses, authorship analysis, text analysis, most influential institutions and citation analysis (Scopus Database, 2020). Findings from the document types indicated that most of the Malaysian taxation research published in Scopus database from 1977 to 2020 using the search term “Malaysia and tax” were published as articles which is equivalent to 79% of the total 88 documents found by the current study. This is followed by conference papers with 14% and 5.1%, 1.2% for book chapters and reviews respectively. This indicated that most of the scholars prefer to publish articles than conference papers, book chapters or reviews. One of the possible reasons for this might be due to benefit of articles especially for achieving academic key performance indicators (Cohen, 2007). Additional reasons could be that for over 16 years back there is calls for the need to migrate from solely books publications by publishers to article publications in a journal which was tagged journal evolution (Daft, & Lewin, 2008). The results on source type from Table 2 indicated that most of the scholars prefer to publish their work in journals instead of conference proceedings, books or book series. The results show that about 84% of the documents extracted were published in journals, followed by conference proceedings with 10.23%, and 3.41% and 2.27% each for books and book series respectively. The reasons could be the same as mentioned under document type. The results related to the document published per year revealed that 2017 received the highest publications of the documents extracted from the Scopus database with 19.48% followed by 2016 with 12.98%. Unfortunately, the publication rate dropped to 9% each in 2018 and 2019 respectively. This finding can serve as a wake-up calls for tax researchers in Malaysia to do more in this domain. The result from Table 4 on languages of documents shows that English language was used for publishing about 98.7% of the documents extracted from Scopus database for the purpose of this study, while Bahasa Melayu account for only 1.7%. Some of the possible reasons for this could be that the majority of the source type such as journals, conference proceedings, books and book series prefer to publish documents in English language because of its wide readership (Ho, 2007). Publications in Bahasa Melayu are mainly for domestic consumption. Results from Table 5 provides evidence of the subject area related to taxation research in Malaysia published in the Scopus database. From the results, it was highlighted that most of the subject area covered are Business, Management and Accounting with 23.56%, followed by Economics, Econometrics and Finance with 22.29%, and the third area was Computer Science with 8.91%. The least was Pharmacology, Toxicology and Pharmaceutics as well as Agricultural and Biological Sciences with 0.63% each. The result shows that tax researchers in Malaysia still need to publish more in the areas of Agricultural and Biological Science, Arts and Humanities, Decision Sciences, Energy, Engineering and Environmental Science. This is because the results from Table 5 shows that these areas received relatively low publications. Hence, more publications are needed in these areas.
Finding from Table 6 concerning the most active source titles show that Advance Science Letters has the highest number of published articles with 14.71% while the remaining journals have 8% and 5% respectively. The findings indicate that researchers can explore other journals with little number of publications, as chances of publications will be more in those journals than journals with much number of publications. The justification for this assertion could be that, getting acceptance in a journal with high volume of paper submissions in a given issue would be low than in a journal with low paper submissions. Results from Table 7 and Figure 2 present the most used keywords from the selected documents. Based on the results, “Malaysia” has the highest frequency of 28 appearances, which is equivalent to 32.94% of the total 88 selected documents. Additionally, based on VOSviewer visualised result, there are about nine clusters which shows the interconnections of one author keywords with others (Sweileh et al., 2017). From the Figure 2 the thickness of the connecting lines, square size and colour were used to depict the relationships with other keywords. More so, keywords with the same colour were listed together. For example, taxation, economic growth and tax revenue have a similar colour (green). Confirmation, goods and services tax and awareness have similar colour (red). This indicates that these groups of keywords are commonly used in one study, the same scenario applies to the remaining clusters. Therefore, Malaysia, corporate governance, current ratio, goods and services tax, awareness, tax compliance, trust, religiosity, tax evasions, tax knowledge, e-governance and e-filing are the most encountered author keywords in the slected documents. Finding from Table 8 presents number of authors per selected documents in this study. These include the number of authors as well as the number of documents published by those authors. Based on the result, about four authors have 9, 5, 3, and 3 publications as single authors, while the remaining are grouped into 2,3,4 and 5 to publish jointly. Additionally, this study examined collaboration of authors using VOSviewer. The results from Figure 3 presents series of authors collaboration using different colours and thick lines appearing from one cluster to another. The authors were selected with minimum number of one document and two citations per authors. The finding depicts the pattern of collaborations amongst some selected authors, for instance, Marimuthu, Bidin, and Aziz are considered as the most collaborating authors with green (colour). The red colur potrayed number of co-authorship with at least one number of documents and two citations. The yellow colour indicates co-authorship with at least two number of documents and two citations. The blue colour also potrayed the co-authorship with at least three number of documents and more than two citations. The green colour depicts the co-autoship with more than three number of documents and more than two citations. Hence, the results portrayed the most collaborating scholars related to taxation field in Malaysia as found in Scopus database. Therefore, the finding can help potential scholars in this domain to find the most suitable and experienced scholars to collaborate with in future research. Figure 4 presents VOSviewer visualization of a term co-occurrence network with a minimum number of 10 co-occurrence of a term based on title and abstract fields (Full Counting) of the documents extracted from the Scopus database. As depicted in Figure 4, “GST” is the main term presented as the central nodes of the entire network (Verk, Golog and Podar,2019) in Malaysian taxation research based on Scopus database. Hence, the size of the nodes displays the weight of the co-occurrence of the terms and the thick lines jointly show the strength of interconnections between the terms. Most of the words that are related are indicated by the same colour and it shows that they frequently co-occurred together. To buttress this point, for instance, the figure suggests that trust, justice, tax compliance, tax incentive, industry, zakat, amount and size are closely related and virtually occurred together. The same applies to other clusters in the same figure. Thus these findings suggest the most words that occurred together in Malaysian tax research. The finding will help researchers to search for documents related to their topics using some of the keywords that occurred together. This will save researchers time when searching for relevant documents for their research. Figure 5 presents the visualization of a term co-occurrence network based on title fields using ten co-occurrences of term from the VOSviewer software. This study used binary counting to construct the co-occurrence network. Binary counting approach refers to the number of times a noun phrase occurs in the title field of a publication (Van, Eck, & Waltman, 2014). Put differently, a noun phrase that appears only once in the title field of a publications is, however, treated in the same way as a noun phrase that occurred ten times (Van et al., 2014). As depicted in Figure 5, “Malaysia” is the main term presented as the central nodes of the entire network (Verk, Golog and Podar,2019) in Malaysian taxation research based on the Scopus database. For instance, the figure suggests that Malaysia, tax compliance, evidence, tax and case are closely related and virtually occurred together in most of the titles of the selected documents. This finding will be of help to the researchers when searching for relevant keywords regarding published documents on Malaysia/taxation especially in the Scopus database. Table 9 present the most influential institutions with minimum of two publications. Based on the result from Table 9, it appears that Universiti Teknologi MARA has the highest published documents based on search term “Malaysia and taxation” in the Scopus database with 18.18% followed by Universiti Utara Malaysia with 15.91% and University Malaya came third with 9.1%. The finding shows the leading institutions in taxation-related publications found in the Scopus database. This will help institutions with low publications to encourage their academic staff and students to publish more in the Scopus database as this will increase their ranking. Table 10 presented citation analysis and the study used Harzing’s Publish or Perish software to obtain the citation metrics from the retrieved data. Based on the result, it was found that the publications covered 43 years from 1977-2020 with a total of 535 citations of the entire 88 documents. The result show that on average, the documents were cited 12.44 times per year. Therefore, this study conclude that the citations can be considered as moderate considering the number of years (43) including the current year 2020 and the small number of the documents (88) over this period. Table 11 present the nine (9) most cited articles based on the number of citations per documents. As pointed earlier, one single article had 187 citations and 13.36 citations per year. The results revealed the most cited authors and documents. The implication of this finding is that the documents with high number of citations can serve as a reference point for other researchers. They can emulate the approach, focus, the structure and design of the paper when making future publications in order to get more citations on their publications which would in turn increase their academic status. Secondly it will help other researchers to select authors for future research collaborations.
More often than not, the findings of this study are in agreement with prior published bibliometric literatures on taxation (Nevzorova et al., 2016; Zhang et al., 2016; de Fonseca & Juca, 2020; Zhou et al., 2020). Consequently, having discussed the findings of this study, it is important to highlight the significance of bibliometric analysis in academic domain. Bibliometric analysis has the potentials and capability to evaluate the productivity of research and publications in a specific research area (Luwei & Nederhof, 2002). Additionally, the findings from bibliometric analysis can assist research funders to evaluate the performance of a particular research in specific area for future policy related decisions as well as comparing the scientific input and output of a potential research area (Gu, 2004). Additionally, bibliometric results can describe possible factors that supports the contributions of studies in a given research domain and possibly guide scholars in making useful research (Akhavan et al., 2016). Towards this end, this study offers several contributions to Malaysian researchers in the field of taxation and potential tax research funders, Inland Revenue Board of Malaysia and the Malaysian government. From the academic viewpoint, this study would assist them in identifying the areas so far covered on taxation in the Malaysian context in order to focus more on the new areas. Secondly, the findings will assist Malaysian researchers in this field to identify the most productive authors for future collaborations. Malaysian research funders in the field of taxation may be interested in this study because it presented the most productive research areas and published documents which is the main target of research funders as this will help them in future policy decisions. From the tax administration point of view, this finding will assist the Inland Revenue Board in identifying potential research area and potential authors to collaborate in conducting future tax research projects in Malaysia. From the government perspective, this study will assist them to identify the most productive institutions for future funding decisions and policy formulation. Nonetheless, despite the aforementioned potential contributions of this study, it has some limitations. For instance, the results emanated from one single database (Scopus) even though there are several databases out there. Therefore, other databases were not covered by this study. Hence, future research can cover other databases to enable wider generalizations of the results. Secondly, the search query was limited to a specific keyword “Malaysia taxation” based on the title, abstract and keywords of the documents.
ACKNOWLEDGMENT
This research received no specific grant from any funding agency in the public, commercial, or not-for profit sectors.
References
- Adhikari, A., Derashid, C., & Zhang, H. (2006). Public policy, political connections, and effective tax rates: Longitudinal evidence from Malaysia. Journal of Accounting and Public Policy, 25(5), 574-595. doi:10.1016/j.jaccpubpol.2006.07.001
- Ahmi, A., & Mohamad, R. (2019). Bibliometric analysis of global scientific literature on web accessibility. International Journal of Recent Technology and Engineering, 7(6), 250–258.
- Ahmi, A., Elbardan, H., & Ali, R. H. R. M. (2019, January). In 2019 International Conference on Electronics, Information, and Communication (ICEIC) (pp. 1-6). IEEE.
- Akhavan, P., Ebrahim, N. A., Fetrati, M. A., & Pezeshkan, A. (2016). Major trends in knowledge management research: A bibliometric study. Scientometrics, 107(3), 1249-1264, doi:10.1007/s11192-016-1938-x
- Burnham, J. F. (2006). “Scopus database: a review,” Biomed. Digit. Libr., 3(1), 1.
- Chadegani, A. A. et al., (2013). “A Comparison between Two Main Academic Literature Collections: Web of Science and Scopus Databases,” Asian Soc. Sci., 9(5).
- Cohen, D. J. (2007). The very separate worlds of academic and practitioner publications in human resource management: Reasons for the divide and concrete solutions for bridging the gap. Academy of Management Journal, 50(5), 1013-1019.
- da Fonseca, P. V., & Juca, M. N. (2020). The influence of taxes on foreign direct investment: systematic Literature review and bibliometric analysis. European Research Studies, 23(2), 55-77.
- Daft, R. L., & Lewin, A. Y. (2008). Perspective—Rigor and relevance in organization studies: Idea migration and academic journal evolution. Organization Science, 19(1), 177-183.
- Derashid, C., & Zhang, H. (2003). Effective tax rates and the “industrial policy” hypothesis: Evidence from Malaysia. Journal of International Accounting, Auditing and Taxation, 12(1), 45-62. doi:10.1016/S1061-9518(03)00003-X
- Dorasamy, M., Marimuthu, M., Raman, M., & Kaliannan, M. (2010). E-government services online: An exploratory study on tax e-filing in Malaysia. International Journal of Electronic Government Research, 6(4), 12-24. doi:10.4018/ jegr.2010100102
- Gu, Y. (2004). Global knowledge management research: A bibliometric analysis. Scientometrics, 61(2), 171-190. doi: 10.1023/B:SCIE.0000041647.01086.f4
- Hall, C. M. (2011). Publish and perish? Bibliometric analysis, journal ranking and the assessment of research quality in tourism. Tourism Management, 32(1), 16-27. doi: 10.1016/j. tourman.2010.07.001
- Ho, Y. S. (2007). Bibliometric analysis of adsorption technology in environmental science. Journal of Environmental Protection Science, 1(1), 1-11.
- Hussein, R., Mohamed, N., Ahlan, A. R., Mahmud, M., & Aditiawarman, U. (2010). An integrated model on online tax adoption in Malaysia. Paper presented at the Proceedings of the European, Mediterranean and Middle Eastern Conference on Information Systems: Global Information Systems Challenges in Management, EMCIS 2010, Retrieved from www.scopus.com
- IGI Global, (2018). “What is Bibliometric Analysis.” [Online]. Available: https://www.igi-global.com/dictionary/bibliometric-analysis/2406. [Accessed: 06-Oct-2018].
- International Tax Malaysia Highlights (2019). Retrieved from: Https://Www2.Deloitte.Com/Content/Dam/Deloitte/Global/ Documents/Tax/Dttl-Tax-Malaysiahighlights-2019.Pdf
- Malpezzi, S., & Mayo, S. K. (1997). Getting housing incentives right: A case study of the effects of regulation, taxes, and subsidies on housing supply in Malaysia. Land Economics, 73(3), 372-391. doi:10.2307/3147174
- Mohd Yusof, N. A., Ling, L. M., & Wah, Y. B. (2014). Tax non-compliance among SMCs in Malaysia: Tax audit evidence. Journal of Applied Accounting Research, 15(2), 215-234. doi:10.1108/JAAR-02-2013-0016
- Narayanan, S. (2014). The impact of the goods and services tax (GST) in Malaysia: Lessons from experiences elsewhere (A note). Singapore Economic Review, 59(2) doi:10.1142/ S021759081450009X
- Nevzorova, E. N., Bobek, S., Kireenko, A. P., & Sklyarov, R. A. (2016). Tax evasion: The discourse among government, business and science community based on bibliometric analysis. Journal of Tax Reform, 2(3), 227-244.
- Pritchard, A. (1969). Statistical bibliography or bibliometrics. Journal of documentation, 25(4), 348-349.
- Rusly, F. H., Ahmi, A., Yakimin, Y., Talib, A., & Rosli, K. (2019). Global perspective on payroll system patent and research: A bibliometric performance. International Journal of Recent Technology and Engineering, 8(2S2), 148–157.
- Santhanamery, T., & Ramayah, T. (2014). Explaining the e-government usage using expectation confirmation model: The case of electronic tax filing in Malaysia. doi:10.1007/978-1-4614-8462-2_15 Retrieved from www.scopus.com
- Sweileh, W. M., Al-Jabi, S. W., AbuTaha, A. S., Sa’ed, H. Z., Anayah, F. M., & Sawalha, A. F. (2017). Bibliometric analysis of worldwide scientific literature in mobile-health: 2006–2016. BMC Medical Informatics and Decision Making, 17(1), 72. doi:10.1186/s12911-017-0476-7
- Van Eck, N. J., & Waltman, L. (2014). Visualizing bibliometric networks. In Measuring Scholarly Impact, (pp. 285-320). Springer, Cham.
- Wahab, M. R. A., & Abdullah, S. B. (2015). Consumer behavior: A study of consumer compliance in paying taxes of local authorities in Malaysia. Advances in Environmental Biology, 9(3), 46-48. Retrieved from www.scopus.com
- World Factbook (2020). https://www.cia.gov/library/publications/ the-world-factbook/geos/my.html
- Zhang, K., Wang, Q., Liang, Q. M., & Chen, H. (2016). A bibliometric analysis of research on carbon tax from 1989 to 2014. Renewable and Sustainable Energy Reviews, 58, 297-310. https://doi.org/10.1016/j.rser.2015.12.089
- Zhou, X., Wei, X., Lin, J., Tian, X., Lev, B., & Wang, S. (2020). Supply chain management under carbon taxes: A review and bibliometric analysis. Omega, 102295.https://doi.org/10.1016/j. omega.2020.102295