Malaysian Public Sector Size: A Comparison with Other ASEAN Countries
- Tunku Puteri Intan Safinaz School of Accountancy, Universiti Utara Malaysia, Kedah
Journal of Business Management and Accounting 11(1) (2021) · https://doi.org/10.32890/jbma2021.11.1.1
Abstract
The aim of this paper is to evaluate the size of the public sector (based on percentage of public sector expenditures to Gross Domestic Product (GDP) and percentage of public sector revenues to GDP) of Malaysia and compare it with other Associations of Southeast Asian Nations (ASEAN) countries. This study utilised a descriptive approach to compare the size of Malaysian public sector with other ASEAN countries (Brunei, Cambodia, Indonesia, Laos, the Philippines, Thailand, and Vietnam). The data were retrieved from 2000 to 2014 (15 years) that involved examination of documents from Key Indicators of Developing Asian and Pacific Countries Reports. Findings revealed that Malaysia ranks number three in terms of the size of public sector among ASEAN countries. Findings also indicated that the Malaysian percentage of public sector expenditure to GDP is around 20% to 30% which is considered as optimal size for the public sector. Malaysia also shows a deficit budget for 2000 to 2014, and similar trends were reported for other ASEAN countries. Meanwhile, the limitations of this study are that it is descriptive in nature and does not test any relationships between variables. Hence, future research may take into account other factors such as economic growth and government efficiency, and test relationships with the size of the public sector.
Keywords: Public sector, government, size, Malaysia, ASEAN
INTRODUCTION
Public sector is the heart of a country as it represents the economic standing of a country. The aims of the public sector are to provide goods and services to citizens, fulfil legal requirements, and achieve accountability while not aiming to maximise profit. The public sector is liable to ensure that there is an effective, efficient, and economical utilisation of public funds or resources which is in line with government aims. It is important to note that the funds and resources come from the public and that there is no individual ownership of the money and public property. The size of the public sector represents the government of a country. Several scholars debated about the size of the public sector; whether having established a big government is necessary in our current world or not. Sugua (2017) believed that a big government is not good for long term economic growth. On the contrary, some believe that a small public sector tends to ignore public welfare through the reduction of roles and responsibilities (Sugua, 2017).
The size of the public sector can also be described through the annual budget provided by the federal government. A study by Tocqueville (1835) as cited in Meltzer and Richard (1981), the spending made by a government is associated with the size of the public sector. Mikesell (2011) claimed that the expenditure side of budgeting made by the public sector sets the size of the public sector. Thus, expenditure or spending made by the federal government every year through the annual budget describes the size of the public sector. Public sector size may become bigger when the government spends more, and it may become smaller if the government spends less.
The public sector size differs across countries and time periods (Katsimi, 1998). There are several measures to evaluate the size of the public sector such as the amount of total public expenditures to GDP (i.e., emoluments, debt service charges, supplies and services, pensions and gratuities, grants and transfers to state governments, subsidies, and other expenditures), and total revenues to GDP (i.e., taxes and non-taxes). Total public expenditure may increase due to two reasons: (1) the scope of government activity or role that may be broadened which pushes the government to increase the amounts and types of goods and service it provides; and (2) the cost of providing a constant level of goods and service that may rise relative to the prices of goods and service in the private sector (Berry & Lowery, 1984).
Today, the public has become more concerned about the size of the public sector. This is because when the size becomes larger, the public must pay more taxes to accommodate the higher public spending of the government (Borre & Viegas, 1995). Larger public sector size may affect the government’s effectiveness in continuous improvement and nation development. According to Alesina and Perotti (1996), larger sized public sectors have the tendency to lose international competitiveness. Other researchers also indicated that large public sector size might negatively affect the demand for exports and employment (Perrson & Tabellini, 1995).
In Malaysia, the former Second Finance Minister, Datuk Johari Abdul Ghani, brought up a matter that was seldom highlighted publicly about the size of public sector. He claimed that the country’s 1.6 million government employees formed the largest proportion of civil service in the world. Thus, the Malaysian Government has a major challenge in controlling the rising costs of running the public sector system (The Star Says, 2017). Therefore, the debating issue on public sector size has triggered researchers to examine the size of Malaysian public sector against other ASEAN countries. This study analysed and discussed the data on the size of public sector from 2000 to 2014.
LITERATURE REVIEW
Public Sector in Malaysia
Syed Soffian, Engku Ismail, and Faudziah Hanim (2011) defined public sector as “a political organisation set up with the power to direct, regulate and control the activities of citizens to enable them to live together harmoniously and constructively, and to solve their common problems more energetically and effectively”. In Malaysia, the public sector refers to the government sector. The Malaysian public sector is divided into three levels, namely, the federal, state, and local governments. The federal government establishes various ministries, departments, and agencies (statutory bodies) in performing its duties. The state governments are the second tier in the government structure, whereas, the local government is the lowest tier of governmental hierarchy in Malaysia (Syed Soffian et al., 2011).
There are three main categories of revenues in the Malaysian public sector, namely, tax revenue, non-tax revenue, and non-revenue receipt. These revenues include revenues from the federal government, state governments, statutory bodies, and local governments. Meanwhile, public sector expenditure is divided into two, namely, operating and development expenditures. Operating expenditure is related to daily activities of the government and it is incurred continuously and repetitively. Development expenditure on the other hand, is long-term capital expenditure that is not normally repetitive in nature (Syed Soffian et al., 2011).
Before 1971, the Malaysian government was more likely to allow economic activities to be determined freely through the interaction of actors in the market. Public spending was used to provide the infrastructure required by the market. However, the government changed the development strategy to high intervention in most of the country’s economic activities in the aftermath of the 13th May 1969 incident. This incident refers to the racial violence in Kuala Lumpur. In the wake of the riots, the New Economic Policy (NEP) was formulated as a social re-engineering and affirmative action programme in 1971 to eradicate poverty as well as reduce and eliminate identification and discrimination of race by economic function and geographical location.
After 20 years of implementation, the NEP was replaced by the National Development Policy (NDP) in 1990. Nonetheless the government continued to pursue most of the NEP policies of affirmative action for the Bumiputera. The government has become an active participant in the Malaysian economy to realise the goals that have been established through the NEP. However, in the mid-1980s, there was a paradigm shift with the adoption of market ideology, in light of changed situations and changing policy priorities of the government. As a result, the role of the government changed from direct intervention to an indirect and supportive one. The government was called for reforms to enable it to perform its new and emerging roles effectively. The major reform was the privatisation policy which falls within the New Public Management (NPM) framework (Nik Rosnah, 2010). Implementation of the NEP, NDP, and NPM frameworks has raised some issues related to the size of the Malaysian public sector.
Public sector size is an important issue to be studied because it has impact toward economic sustainability in a country and it shows how the government spends its revenues through the annual budget (Sugua, 2017). In short, fiscal policy (annual budget) is a fiscal tool use by the federal government to stabilize and sustain the economy.
Size of the Public Sector
The size of the public sector represents the share of government resources in a national economy (Lee, 2005). According to Di Matteo (2016), public sector size is an important issue because it can affect economic performance of a country through taxation, expenditure, and regulatory functions. In addition, public sector size can also affect allocation of resources and economic growth. Analysis done by Facchini and Melki (2011) indicated that 64% of previous studies found a negative effect of government size, while only 11% found the opposite effect, and 25% were inconclusive. Hence, the negative influence of government size has become more obvious.
Several measures that can be used to evaluate the size of the public sector are the amount of total public expenditures and total revenues to GDP, tax collection as well as the number of public sector employment to total employment (Statistics Sweden, 2006). According to Brown and Jackson (1986), the size of the public sector is often measured by comparing the amount of government spending to the national aggregate income. Based on analysis of previous studies, Facchini and Melki (2011) stated that the optimal size of public sector could vary from around 20% to 50% of GDP. Shumaila and Abdul (2014) analysed the optimal size of public sector in Pakistan for the period from 1973 to 2012. The researchers measured government size based on government expenditure as a share of GDP. The results showed that the public sector size in Pakistan was around 18%, a bit higher than the optimal size of 17%. A recent study conducted by El Husseiny (2019) found that the estimated optimal size of the public sector ranges from 30.5% to 31.2% of GDP, indicating that the size of Egypt public sector is neither too big nor too small from the perspective of economic growth maximisation.
Meanwhile, Alberto and Wacziarg (1998) found evidence that country size is negatively related to public sector size and trade openness. They stated that government consumption as a share of GDP, is smaller in larger countries and tends to be more open to international trade. When the two facts are taken together, it may account for the observation that open countries have larger public sector sizes. Their study measured the size of the public sector based on the share of public sector consumption in GDP, excluding interest payments, transfers, and public investments. Gupta, Leruth, De Mello, and Chakravarti (2003) documented that the decrease in the size of public sector in transition economies is not due to purposeful policy, but rather, from their failure to get finances to sustain greater levels of public sector expenditure. DiPeitro and Anoruo (2012) showed that the size of public sector and public debt exerts a negative effect on real economic growth. Ghali (1998) found that public sector size causes economic growth, and that public sector size could indirectly affect economic growth through investment and international trade.
In Latin America, Stein (1998) found that the evolution of public sector size has been uneven. It showed a rapid growth through the 1970s and early 1980s. Then, the size of public sectors in Latin America decreased tremendously in the late 1980s following the debt crisis and has remained fairly stable since the beginning of the 1990s. The average size of the public sector as measured by the expenditure of consolidated public sector stood at 28% of GDP in the 1990s.
Meanwhile, Mithani and Khoon (1999) conducted a study on the effect of seasonality in examining causal relationship between quarterly public sector revenues, and public sector expenditures in Malaysia for the period from 1970 to 1994. The study suggested that the size and growth of the public sector and consequential tax burden as well as fiscal deficit in Malaysia are largely determined by spending decision. In short, they found that the public sector in Malaysia is affected by decisions on public expenditures. Sugua (2017) analysed and discussed the size of public sector within the context of annual budget made by the Malaysian Federal Government from 2000 until 2014. Sugua (2017) concluded that Malaysia is currently moving toward big public sector and this is not a good indication, as the bigger size of public sector would bring bad effects toward economic, fiscal, as well as social sustainability. The researcher suggested that the government should critically review its annual budget, especially on reducing operating expenditure.
As mentioned earlier, the size of public sector can also be measured using percentage of revenues to GDP. Since the government provides public consumptive and productive services free of charge, it is necessary to have sources of tax revenues. Bhattarai (2010) stated that the Organisation for Economic Co-operation and Development (OECD) governments receive most of their revenues from direct taxes on personal or corporate income or indirect taxes on consumption of goods and services, and their structures vary enormously across countries. The study provided evidence that countries with higher tax GDP ratio generally have lower growth rates, as compared to other countries with smaller-sized public sector from 1994 to 2006.
In comparing the size of the Malaysian public sector with other ASEAN countries (based on percentage of consumption expenditure to GDP), Siti Alida and Halimah (2001) found that the size of the Malaysian public sector is larger than those in Singapore and Thailand. In comparison to five OECD countries (Sweden, United Kingdom, Germany, United States, and Turkey), the size of the Malaysian public sector falls the second smallest in the OECD country ranking.
The ASEAN Economy
ASEAN has dramatically increased performance from the rest of the world in growth of GDP per capita since the late 1970s. Income growth has remained strong since 2000, with average annual real gains of more than five percent. If ASEAN is considered as a country, thus it would be the seventh-largest economy in the world, with a combined GDP of $2.4 trillion in 2013. Meanwhile, a study by Vinayak, Thompson, and Tonby (2014) showed that 14% of the region’s population is living below the international poverty line of $1.25 a day. In 2013, that share had fallen to just 3% (Wood, 2017), and it is forecasted that by 2050, ASEAN becomes the fourth-largest economy. The population in ASEAN is more than 600 million people, and ASEAN has become a larger population than the European Union or North America. ASEAN also has been the third-largest labour force in the world behind China and India (Wood, 2017).
GDP growth in the ASEAN region has increased due to labour- force expansion and productivity improvement. Economic growth and expansion in trade have increased tangible benefits to Southeast Asian people. ASEAN’s GDP per capita reached $3,748 in 2012 which was more than double that of $1,172 in 2000. Over the last decade, poverty levels across the region have decreased. For example, the Nation reported that in Cambodia, Laos, Myanmar, and Vietnam, the proportion of the population living on less than $1.25 a day fell to 16% in 2010, from 45% in 2000. Table 1 shows the population and nominal GDP by ASEAN countries (Ramirez & Pooittiwong, 2016).
| Country | Population (millions) | Nominal GDP (Millions USD) |
|---|---|---|
| ASEAN | 628.78 | 2,459,381 |
| Indonesia | 255.46 | 872,615 |
| Thailand | 68.84 | 373,536 |
| Malaysia | 31.12 | 313,479 |
| Philippines | 101.42 | 299,314 |
| Singapore | 5.52 | 293,959 |
| Vietnam | 91.58 | 198,805 |
| Myanmar | 51.85 | 65,775 |
| Cambodia | 15.54 | 17,714 |
| Laos | 7.03 | 12,548 |
| Brunei | 0.42 | 11,636 |
The Importance of ASEAN
In ASEAN, there are 67 million households that are categorised as the “consuming class”, with incomes exceeding the level at which they can begin to make significant discretionary purchases. The number may become almost double to 125 million households by 2025, making ASEAN a key consumer market of the future. There is no typical ASEAN consumer, but trends have shifted to a greater focus on leisure activities, a growing preference for modern retail formats, and increasing brand awareness (Vinayak et al., 2014).
Urbanisation and consumer growth have moved simultaneously, and ASEAN cities are booming. In 2014, 22% of ASEAN population live in cities of more than 200,000 people and these urban areas account for more than 54% of the region’s GDP. An additional 54 million people are expected to move to cities by 2025. It is forecasted that nearly 40% of ASEAN GDP growth in 2025 is expected to come from 142 cities with populations between 200,000 and 5 million (Vinayak et al., 2014).
Despite high population and growth, the 10 member states of ASEAN share a focus on jobs and prosperity. A rising household purchasing power is transforming ASEAN into the next frontier of consumer growth. Thus in keeping with this rapid pace, it is necessary for ASEAN to step forward to become globally competitive in a wide range of industries (Vinayak et al., 2014).
METHODOLOGY
This study utilised a descriptive approach to compare the size of Malaysian public sector with other ASEAN countries (Brunei, Cambodia, Indonesia, Laos, Malaysia, the Philippines, Thailand, and Vietnam). Data collection involved examination of documents from Key Indicators of Developing Asian and Pacific Countries Report which was accessed from the Asian Development Bank (2019) website. The data were retrieved from 2000 to 2014 for all ASEAN countries including Malaysia. The years 2000 to 2014 (15 years) were selected as it was the latest years when the study was conducted in 2016. However, Singapore only provided data for every five years. Thus, it was not appropriate for the dataset that were required for this study. For Myanmar, no data was provided through the website for the required period.
Analysis on the size of the public sector was based on total expenditures compared to GDP, and total revenues compared to GDP. They are common indicators used in public sectors to reflect expenditures and revenues of the country. Previous studies by Statistics Sweden (2006), Alberto and Wacziarg (1998), and DiPeitro and Anoruo
(2012) also applied the same measurements. In terms of the variable measurement; 1) Expenditures (% of GDP) was measured as sum of current and capital expenditure, expressed as a percentage of GDP; 2) Government consumption (% of GDP) was measured as all current outlays on purchases of goods and services (including wages and salaries), which also includes most expenditure on national defence and security, but excludes government military expenditure that is part of public investment; 3) Revenues (% of GDP) was measured as current and capital revenues, expressed as a percentage of GDP; 4) Total taxes (% of GDP) was measured as compulsory transfers to the government for public purposes, expressed as a percentage of GDP; 5) Total non-taxes (% of GDP) was measured as certain compulsory transfers such as fines, penalties, and most social security contributions; and 6) Deficit/surplus budget (% of GDP) was measured as difference between total revenues (including grants) and total expenditures (including net lending), expressed as a percentage of GDP (Asian Development Bank, 2016).
RESULTS
The research findings were presented in the form of charts for data from 2000 to 2014. The findings compared the size of the Malaysian public sector with other ASEAN countries based on public sector expenditures and revenues.
A Comparison of the Size: Public Sector Expenditure
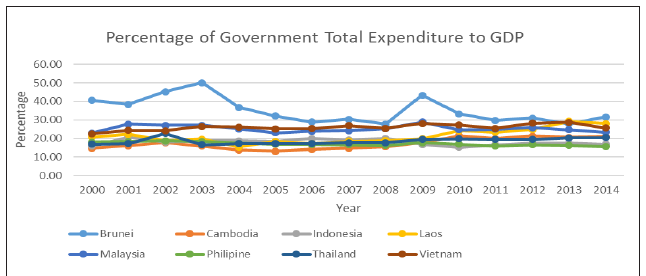
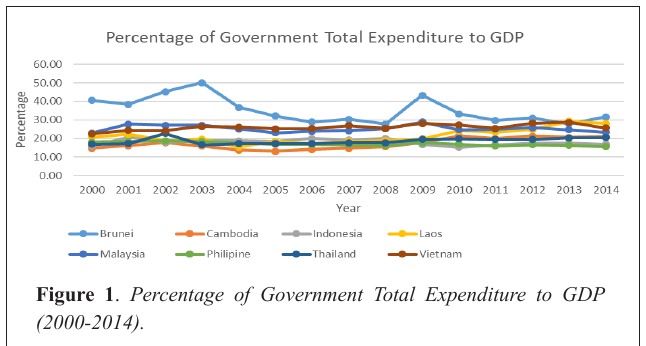
Figure 1 shows that the average public sector total expenditures to GDP for ASEAN countries, which were about 12% to 40% from 2000 to 2014. Brunei showed the highest public sector total expenditures to GDP as the country had sufficient funds to allocate for the country. These findings are consistent with previous studies which showed that countries with high GDP tend to spend more as money is available to build the nation and society (Brown & Jackson, 1986; Alberto & Wacziarg, 1998). For other ASEAN countries, the public sector total expenditures were moderate. It was also observed that the government total expenditures for all ASEAN countries have decreased from 2004 to 2014. This implies that most ASEAN countries had progressively developed their respective country by maintaining a low public spending policy. Malaysia has achieved around 20% to 30% public A Comparison of the Size: Public Sector Expenditure
Figure 1 shows that the average public sector total expenditures to GDP for ASEAN countries, which were about 12%oftoBusiness Journal 40% from 2000 to 2014. Management Brunei showed and Accounting, Vol. 11,the highest Number public sector 1 (January) 2021,total expenditures to pp: 1–20 GDP as the country had sufficient funds to allocate for the country. These findings are consistent with previous studies which showed that countries with high GDP tend to spend more as money is available to build the nation and society (Brown & Jackson, 1986; Alberto & Wacziarg, 1998). For other ASEAN sector countries, total sector the public expenditures to GDP total expenditures which were is considered moderate. as optimal It was also observed that thesize government total expenditures for all ASEAN countries have decreased from 2004 to 2014. This implies that most for a country. This is consistent with findings by Facchini and ASEAN countries had progressively developed their respective country by maintaining a low public Melki (2011) spending policy.where thehas Malaysia optimal size achieved of public around 20% tosector 30% publiccouldsector varytotal from around to GDP expenditures which 20% is considered to 50% as of optimal GDP. size for a country. This is consistent with findings by Facchini and Melki (2011) where the optimal size of public sector could vary from around 20% to 50% of GDP.
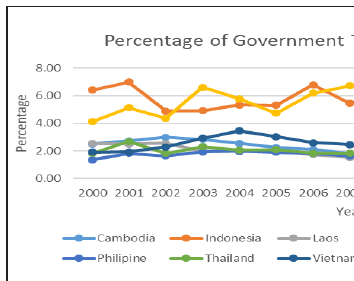
GDP. Although Vietnam is similar to other ASEAN countries which focus on agriculture, the percentage total non-taxes to GDP, as explained in Figure 4 and Figure 5. With of revenues generated for Vietnam is high due to higher taxes that range from 18% to 22 % (refer to
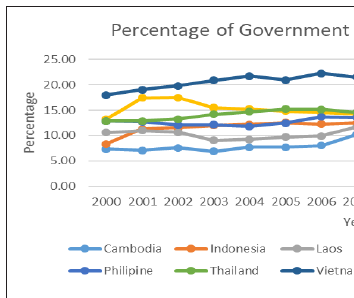
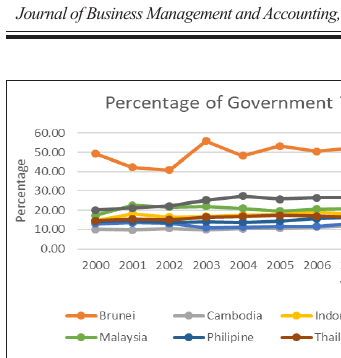
Figure 6 shows detailed percentage of government revenues for individual ASEAN Countries comparing government total revenues to GDP (%), total taxes of GDP (%), and total non-taxes of GDP (%). Overall, 14 is reported for all ASEAN countries where tax revenues contribute a major share of a similar trend government revenues. It shows that tax revenues are the most important sources of government income. The similar trend is also witnessed in OECD countries, as reported by Bhattarai (2010). The author stated that OECD governments receive most of their revenues from taxes.
Figure 6 shows detailed percentage of government revenues for individual ASEAN Countries comparing government total revenues to GDP Figure (%), total taxes 5. Percentage Percentage of GDPTotal of Government Government (%), and total Non-Taxes non-taxes of GDP (%). Figure 5. of Total Non-Taxes totoGDP GDP (2000-2014). (2000-2014). Overall, Figure

deficit budget where public sector spending is more than the revenues earned by the government. GDP 30.00 25.00
Percentage 20.00 15.00 10.00 5.00 0.00 2000 2001 2002 2003 2004 2005 2006 2007 2008 2009 2010 2011 2012 2013 2014 Year overall budgetary surplus to GDP of about 10% but by 2002 it fell to Government Total Revenue to GDP (%) Total Taxes % of GDP Total Non-Taxes % of GDP
-10%. It then started to increase slowly beginning 2003 and reached a surplus ofPercentage
CONCLUSION
The aim of this paper is to evaluate the size of the Malaysian public sector with other ASEAN countries. Based on the findings, it can be concluded that Malaysia ranks number three in terms of the size of public sector among ASEAN countries. For Malaysia, measurement of public sector expenditures to GDP of around 20% to 30% is considered as optimal public sector size. Malaysia also showed a deficit budget for 2000 to 2014, and a similar trend is reported with other ASEAN countries except for Brunei. Brunei is a rich country with resources generated from its oil reserves, while other countries are more dependent on agricultural activities as their main economy. ASEAN countries need to practice careful spending to reduce government debts, especially from external funds.
This study contributes significant to the body of knowledge in enriching the literature regarding the size of public sector, and thus narrowing the gap in the existing literature especially in Malaysia and other ASEAN public sector environments. This study compared the size of Malaysian public sector with other ASEAN countries. It was different from previous study by Sugua (2017) that analysed public sector size based on operating expenditures in Malaysia, whilst Siti Alida and Halimah (2001) compared size of Malaysian public sector with only two ASEAN countries (Singapore and Thailand).
From the practical perspective, the results would be useful to public administrators, regulatory bodies, and policy makers, to benchmark the current situation with past years in making a sound decision. The findings from period 2000 to 2014 showed that the Malaysian government size was in the optimal range. However, Malaysia has been practising deficit budget for that period of study. Therefore, policy makers have to ensure that government size (percentage of expenditure to GDP) does not increase significantly in the future. The government should not heavily rely on debts (internal or external debts) as it could increase the fiscal deficit. Percentage of revenues to GDP allows the government to improve the infrastructure and public welfare. However, ideal government size should be maintained to ensure that the citizens are not burdened by having to pay higher taxes. The government also needs to ensure that the size is consistently within the optimal range. If it is too small, welfare and well-being of citizens will be sacrificed. On the other hand, if the public sector size is too big, it is not good for fiscal and economic stability.
The related bodies may utilise these findings in preparation on how to face future situations if economic downturn recurs. Our economy is agile and sensitive to changes; thus, the situation may come back. Hence, these findings will help the government in optimising Malaysian revenues and expenditures. Comparisons between the size of the Malaysian public sector and other ASEAN countries can explain where Malaysia is positioning itself against other ASEAN countries, and the appropriate fiscal policies to be taken by Malaysia.
As other reported research, this study is not without limitations. Firstly, this research is descriptive in nature and it does not test any relationships between variables. Hence, for future research, studies can be conducted to examine the influence of public sector size on variables such as economic growth, and government efficiency. Secondly, this study only compared the size of the public sector of Malaysia with other ASEAN countries. Therefore, future studies can compare the size of the public sector with other countries in Asia, Europe, and United States.
ACKNOWLEDGMENT
We would like to thank Universiti Utara Malaysia for granting the funds and support for this research. This work was supported by the Geran Penjanaan (S/O Code 13512, 2016).
References
- Alberto, A., & Wacziarg. R. (1998). Openness, country size, and government. Journal of Public Economics, 69(3), 305-321.
- Alesina, A., & Perotti, R. (1996). Budget deficits and budget institutions. US: National Bureau of Economic Research.
- Asian Development Bank (2019). Key indicators database. Retrieved from https://kidb.adb.org/ kidb/.
- Berry, W. D., & Lowery, D. (1984). The measurement of government size: Implication for the study of government growth. The Journal of Politics, 46, 1193-1206.
- Bhattarai, K. (2010). Taxes, public spending, and economic growth in OECD countries. Problems and Perspectives in Management, 8(1), 14-30.
- Borre, O., & Viegas, J. M. (1995). The scope of government: 9 government intervention in the economy. US: Oxford University Press.
- Brown, C. V., & Jackson, P. M. L. (1986). Public sector economics (3rd ed.). Oxford: Basil Blackwell Limited.
- Chelliah, R. J. (1975). Trends in taxation in developing countries. In R. M. Bird, & O. Oldman, Readings on taxation in developing countries. Baltimore: John Hopkins University Press.
- Di Matteo, L. (2016). Does the size of government affect economic performance? Absolutely. US: Fraser Institute.
- DiPeitro, W. R., & Anoruo, E. (2012). Government size, public debt, and real economic growth: A panel analysis. Journal of Economic Studies, 39(4), 410-419.
- El-Husseiny, I. (2019). The optimal size of government in Egypt: An empirical investigation. The Journal of North African Studies, 24(2), 271-299.
- Facchini, F., & Melki, M. (2011). Optimal government size and economic growth in France (1871-2008): An explanation by the State and Market failures. Retrieved from https://halshs.a rchives-ouvertes.fr/halshs-00654363.
- Ghali, K. H. (1998). Public investment and private capital formation in a vector, error-correction model of growth. Applied Economics, 30(6), 837-844.
- Gupta, S., Leruth, L., De Mello, L. R., & Chakravarti, S. (2003). Transition economies: How appropriate is the size and scope of government? Comparative Economic Studies, 45(40), 554-576.
- Hinrichs, H. H. (1966). A general theory of tax structure change during economic development. Cambridge: Harvard Law School.
- Katsimi, M. (1998). Explaining the size of public sector. Public Choice, 96, 117-144.
- Lee, C. L. (2005). Income inequality, democracy and public sector size. American Sociological Review, 70(Feb), 158-181.
- Meltzer, A. H., & Richard, S. F. (1981). A rational theory of the size of government. Journal of Political Economy, 89(5), 914-927. Retrieved from http://www.jstor.org/stable/1830813.
- Mikesell, J. E. (2011). Fiscal administration: Analysis and applications for the public sector (9th ed.). Wadsworth: Cengage Learning
- Ministry of Finance Malaysia (2016). Economic data. Retrieved from http://www.treasury.gov.m y/index.php/en/economy/ economic-data.html.
- Mithani, D. M., & Khoon, G. S. (1999). Causality between government expenditures and revenues in Malaysia: A seasonal cointegration test. ASEAN Economic Bulletin, 16(1), 68-79.
- Nik Rosnah, W. A. (2010). Public Sector Reform in Malaysia – Addressing the Inequalities. Retrieved from http://eprints. um.edu.my/11315/1/Rosnah_Wan_Abdullah_WG111.pdf
- Persson, T., & Tabellini, G. (1995). Handbook of international economics. Double-edged incentives: Institutions and policy coordination, 3, 1973-2030. https://doi.org/10.1016/S1573-4404(05)80018-8.
- Ramirez, B., & Pooittiwong, A. (2016). ASEAN economic integration: Opportunities and challenges that lie ahead. Retrieved from https://intpolicydigest.org/2016/01/06/asean-economic-integration-opportunities-and-challenges-that-lie-ahead/
- Shumaila, Z. & Abdul, Q. (2014). An analysis of optimal government size for growth: A case study of Pakistan. Retrieved from https://mpra.ub.uni-muenchen.de/58989/1/MPRA_paper_5 8989.pdf.
- Siti Alida, J. A., & Halimah, N. A. (2001). Penilaian saiz sektor awam di Malaysia semenjak Dasar Ekonomi Baru dan perbandingan dengan beberapa buah negara [Public sector size evaluation in Malaysia since the New Economic Policy and comparison with several countries]. School of Social Development, Universiti Utara Malaysia.
- Smith, P. (2018). Getting the tax-to-GDP ratio right. Retrieved from https://www.accaglobal.com/us/en/member/member/ accounting-business/2018/01/insights/tax -gdp.html.
- Stein, E. (1998). Fiscal decentralisation and government size in Latin America. Working Paper No. 368, Office of the Chief Economist, Inter-American Development Bank.
- Statistics Sweden (2006). Public Finance in Sweden. Retrieved from www.scb.sè/statistik_publik ationer/OE0903_2004AO1_ BR_07_OEO6SA0602.pdf.
- Sugua, M. (2017). An analysis on the size of government in Malaysia. Retrieved from https://ww w.academia.edu/5140736/ Govermnent_Size_-_Malaysia.
- Syed Soffian, S. I., Engku Ismail, E. A., Faudziah Hanim, H. F., & Hassan, H. (2011). Public sector accounting and financial management in Malaysia. Kuala Lumpur: Pearson Custom Publishing.
- The Star Says (2017, 5 February). An effective civil service does not burden Govt. Retrieved from https://www.thestar.com.my/ opinion/columnists/the-star-says/2017/02/05/an-effective-civil-service-does-not-burden-govt.
- Vinayak, H. V., Thompson, F., & Tonby, O. (2014). Understanding ASEAN: Seven things you need to know. Retrieved from https://www.mckinsey.com/industries/public-and-social-sector/ our-insights/understanding-asean-seven-things-you-need-to-know.
- Wood, J. (2017). What is ASEAN? Retrieved from https://www. weforum.org/agenda/2017/05/wh at-is-asean-explainer/.