The Influence of Service Quality of Mobile Phone on Customer Satisfaction in Malaysia: A Students’ Feedback Survey
- College of Business, Universiti Utara Malaysia
Journal of Business Management and Accounting 1(1) (2011) · https://doi.org/10.32890/jbma2011.1.1.8917
Abstract
The study examines the student’s satisfaction of the quality of services rendered by mobile phone service provider in Malaysia. A cross-sectional survey was conducted using 342 postgraduate students of Universiti Utara Malaysia main campus at Sintok. The result reveals that tangibility was the most important dimension of mobile service quality, while empathy was found to be the least important dimension. The result further shows that the adjusted R² of 0.435 indicates 43.5 percent of variance in customer satisfaction could be predicted by the quality of service delivered by the mobile service providers. Based on the fi ndings, it is therefore recommended that the mobile service providers could make some paradigm changes with regard to the fi ve dimensions of service quality in order to enhance customers’ satisfaction. These changes include focusing on tangible cues, fulfi lling promises, being courteous all of which customers used to evaluate service delivery. Finally, limitations of the study were highlighted, and consequently directions for future research were suggested.
Keywords: service quality, customer satisfaction, telecommunication and Malaysia
Introduction
In the contemporary competitive markets services being offered by companies within the same industry are becoming increasingly similar. Thus, differentiation through the delivery channel is difficult. A growing number of service companies have embarked on positioning through the communication channel with the objective of building strong corporate images in order to create relative attractiveness for their offerings (Andreassen & Bredal, 1996). Mobile telephone is one of such sector in the services industry. Asia has the world’s largest users of wireless phones with an estimated 600 million users in 2005 Malaysian Communication and Multimedia Commission (2004). Malaysian wireless phone users have reached 14.5 million (55.9 percent) in 2004, exceeding half of the total population. This number will continue to grow once the 3G technology * fully operates. According to the research conducted by the Malaysian Multimedia Commission, the number of wireless phone users has also exceeded those of the fixed lines; and about 74 percents of the users sent at least one SMS a day. Telecommunication technology is developing in such a rapid speed and wireless communication capabilities are evolving rapidly across the spectrum. The first generation standard (1G) for voice only was developed in 1979. This is followed by the second generation (2G) standard using global system for mobile communications (GSM)/TDMA – time division multiple access, which emerged in 1992. TDMA is a technology for delivering a digital wireless service using the time-division multiplexing (TDM) technique. The widespread use of mobile phone technologies as compared to the use of personal computers can be clearly seen across all walks of life in the Malaysian society. While internet usage tend to be dominated by middle to high class members of society, the penetration of the mobile phone usage seems to cut across the lower and the minority class boundaries. These users include the minority racial groups, the lower class groups, young adults, and old adult users. The result of Malaysian Communication and Multimedia Commission (2004) survey indicates that 12.3 percent of the user groups are young adults, while the older groups accounted for about 9 percent. Thus, it can be deducted that the mobile phone usage would perhaps be more widespread among students at the institution of higher learning. Service quality is the major driving force for business sustainability and also in today’s competitive global marketplace, it is recognized that high quality service is essential for the success of the firm (Carlzon, 1987; Rust & Oliver, 1994). Hence, in an increasingly competitive environment, companies must be customer oriented (Kotler, 1997). After all, the underpinning of the marketing concept is that identification and satisfaction of customer needs, lead to improved customer retention (Day, 1994). Thus, companies spend substantial resources to measure and manage customer satisfaction. In effect, the most frequently mentioned major goal of the marketing process is customer satisfaction. Customer satisfaction is indeed an important issue and critical component for marketing managers, particularly those in service industries. During the last decades, satisfaction has been considered as one of the most important theoretical as well as practical issues for most marketers and consumer researchers (Jamal, 2004). However, no single definition of satisfaction has been unanimously accepted in the literature and all definitions proposed, however, agree that the concept of satisfaction implies the necessary presence of a goal the consumer wants to achieve. According to Homburg, Koschate, and Hoyer (2006), previous research has recognized that both cognition (Bearden & Teel, 1983; LaBarbea & Mazursky, 1983; Oliver, 1980; Oliver & DeSarbo, 1988) and affect (Mano & Oliver, 1993; Westbrook & Oliver, 1991) significantly predict customer satisfaction judgments. Customer satisfaction is an important theoretical as well as practical issue for most marketers and consumer researchers (Dabholkar, Thorpe & Rentz, 1996; Fournier &
The Influence of Service Quality of Mobile Phone on Customer Satisfaction in Malaysia: A Students’ Feedback Survey: 79-97
Mick, 1999; Meuter, Ostrom, Roundtree & Bitner, 2000). Customer satisfaction can be considered as the essence of companies’ success in today’s highly competitive world of business. Thus, the significance of customer satisfaction and customer retention in strategy development for “market oriented” and ‘customer focused’ firms cannot be underestimated (Kohli & Jaworski, 1990). Consequently, customer satisfaction is increasingly becoming corporate goal as more and more companies strive for high quality in their products and services, with a view to eventually succeed in satisfying their customers (Bitner & Hubbert, 1994). The importance of the services sector in the world economy keeps growing rapidly. As countries become more developed and income levels rise, the observable trend, known as the “hollowing out effect” sets in; this means that the emphasis of economic activity shifts from the agricultural and manufacturing sectors to services (Lovelock, Patterson & Walker, 2004). This makes research on services increasingly important and relevant to the developing economies in Asia which have enjoyed relatively high economic growth rates in the past decade. As such, a better understanding of consumer service expectations in the region is potentially valuable to both the marketing practitioners and researchers. Similarly, it could be said that service sector in the contemporary time is a dominant sector as far as economic activities are concerned. Thus, achieving improvements in customer service is now recognized as a major challenge facing manufacturing and service industries throughout the world. Mobile phone as a subindustry in the general service sector is highly competitive and the tendency of customer to switch is high, hence customer satisfaction and retention is difficult (Aydin, Ozer & Arasil, 2005). Based on the foregoing therefore, the objective of the study is to investigate the extent of relationship between the five dimensions of service quality (i.e. tangibility, reliability, responsiveness, assurance and empathy) on one hand and customer satisfaction on the other hand, in the Malaysian mobile phone industry. Consequently, the presentation outline of the paper is as follows: Section 2 presents the review of related literature, followed by discussion on the methodology adopted for the paper in Section 3 and results presentation in Section 4; Section 5 concludes the paper.
Literature review
Customer satisfaction
Customer satisfaction is generally described as the full meeting of one’s expectations (Oliver, 1980). Thus, customer satisfaction is the degree of feeling or attitude of a customer towards a product or service after it has been used. In effect, customer satisfaction is a major goal and outcome of marketing activity whereby it serves as a link between the various stages of consumer buying behavior. For instance, if customers are satisfied with a particular service offering after usage, then they are likely to engage in repeat purchase and try line extensions (East, 1997). Customer satisfaction is widely recognized as a key influence in the formation of customers’ future purchase intentions (Taylor & Baker, 1994). Consequently, achieving customer satisfaction is the primary goal for most service firms today (Jones & Sasser, 1995). Customer satisfaction is an elusive area especially in service sector since offerings are intangible. In fact, it has been said that intangibility is the key to determining whether or not an offering is a service or a product. Customer satisfaction is the sum total of the customers expression of the service quality. Thus, the survival of business has direct correlation with the satisfaction of the customer. Customer satisfaction, which is attributed to the conduct of business, has certain specific dimensions (Jones & Sasser, 1995). Apparently, customer satisfaction is an important theoretical as well as practical issue for most researchers in marketing and consumer behavior (Dabholkar et al., 1996; Fournier & Mick, 1999; Meuter et al., 2000). The importance of customer satisfaction has been mentioned and stressed by many researchers and professionals. Anderson and Fornell (1994) stated that “customers are increasingly becoming scarce resource pursued by a fast growing number of aggressive suppliers”. They therefore, added that customer satisfaction is central in determining the performance of business organizations. Based on this, customer satisfaction can be considered the essence of success in today’s highly competitive world of business. Thus, the significance of customer satisfaction and customer retention in business strategy development for a “market oriented” and “customer focused” firm cannot be underestimated (Kohli & Jaworski, 1990). Consequently, customer satisfaction is increasingly becoming a corporate goal as more and more companies strive for quality in their products and services (Bitner & Hubbert, 1994). In line with that, Pizam and Ellis (1999) stressed that customer satisfaction is not a universal phenomenon, and not every customer gets the same satisfaction out of the same encounter. The reason is that customers have different needs, objectives and past experiences that influence their expectations. Therefore, it is important to get a clear picture of the customer needs and objectives that correspond to different kinds of satisfaction (Pizam & Ellis 1999). This means that, a customer may respond to the same service quality (evaluated objectively) with distinct level of satisfaction, which can be affected by various factors. Typically, service firms monitor customer satisfaction as a continuous process using Likert-type rating scales that measure customers’ level of satisfaction based on their last service encounter (Heskett, Sasser & Schlesinger, 1997; Peterson & Wilson, 1992).
The Influence of Service Quality of Mobile Phone on Customer Satisfaction in Malaysia: A Students’ Feedback Survey: 79-97
Determinants of customer satisfaction
Although there is a general consensus on the differences between service quality and customer satisfaction from a conceptual point of view; but the operationalization of customer satisfaction is somehow hazy. For instance, Cronin and Taylor (1992) define and measure customer satisfaction as a one-item scale that seeks to elicit the customers’ overall feeling towards an organization. Bitner and Hubert (1994) use four items to measure the customers’ overall satisfaction with the service provider. The authors introduce the concept of encounter satisfaction (i.e. the customers’ satisfaction with a discrete service encounter), and devised a nine-item scale to measure it. 2.3
Service quality
Service quality and customer satisfaction are inarguably the two core concepts that are the crux of the marketing theory and practice (Spreng & Mackoy, 1996). Thus it is presumed that in today’s world of intense competition, the key to sustainable competitive advantage lies in delivering high quality service which in turn results in customer satisfaction. Cronin and Taylor (1992) support the view that service quality is an antecedent of customer satisfaction; and that customer satisfaction exerts a stronger influence on future purchase intentions than service quality. It is argued that customers do not necessarily purchase the highest quality service; they may also weigh convenience, price, and availability factors (Cronin & Taylor 1992). Additionally, the customer’s personal experience with the service provider (that is, courtesy, waiting time, empathy, responsiveness, and so on) also impacts customer satisfaction (Nowak, 1997). Definitions of service quality hold that it is the result of the comparison that customers make between their expectations about a service and their perception of the way the service has been performed (Gronroos, 1984; Lehtinen & Lehtinen, 1982; Lewis & Booms, 1983; Parasuraman, Zeithaml, & Berry, 1985, 1988, 1994). On the other hand, service quality has been described as a form of attitude – long-run/overall evaluation, and the two constructs (i.e. service quality and attitude) are viewed as similar (Bitner et al., 1990; Bitner & Hubert, 1994; Bolton & Drew, 1991; Cronin & Taylor, 1992; Parasuraman et al., 1988; Zeithaml, 1988). According to Parasuraman et al. (1988), the quality of service should be evaluated based on the customer’s perception and not from the service provider’s point of view. Similarly, Fornell (1991) stated that each company has its own definition for quality. However, it is the customer’s definition of quality that is more important. Meaning that, the specifications are not set on the basis of what managers perceive to be important, because manager’s views may differ considerably from customers view. This view of service quality is similar to that of Parasuraman et al. (1988). Therefore, service quality must be viewed from the perspective of customers.
In summary, Herbig and Genestre (1996) conclude that service quality can be defined in one of three ways: 1. 2. 3. 2.4
Service quality is conforming to specifications. The service quality depends on how well it measures up a set of specifications. Service quality lies in the eyes of the beholder. It is extremely subjective. Service quality is simply what the users say it is, whether rational or not. Service quality is innate excellence. Although styles and taste change, there is something enduring about the performance of high quality. Determinants of service quality
A number of researchers have provided lists of service quality determinants, (e.g. Albrecht & Zemke, 1985; Armistead, 1990). However, the popular determinants emanate from the research by Parasuraman et al., (1988). Goods quality is tangible and can be measured by objective indicators like performance, features, and durability. Service, however, is intangible; hence, the service quality is defined in terms of subjectivity, attitude, and perception (Zeithaml, 1987). Furthermore, Parasuraman et al. (1985) provide a list of determinants of service quality: access, communication, competence, courtesy, credibility, reliability, responsiveness, security, understanding, and tangibles. These are initial 10 dimensions of service quality which were later on condensed into 5 dimensions as briefly defined below: 1. 2. 3. 4. 5. 2.5
Reliability: The ability to perform the promised service dependably and accurately. Responsiveness: The willingness to help customers and provide prompt service. Assurance: The knowledge and courtesy of employees and their ability to convey trust and confidence. Empathy: The caring, individualized attention provided to customers. Tangibles: The appearance of physical facilities, equipment, personnel, and communication materials. Service quality and customer satisfaction
The relationship between customer satisfaction and service quality has received a good deal of attention in the literature (cf. Bolton & Drew, 1994). However, the vast majority of articles attempting to examine this interrelationship have been of a nonempirical nature (Iacobucci, Ostrom & Grayson, 1995). Anderson and Fornell (1994) indicate that the literature is not very clear about the distinction between quality and satisfaction. Rust and Oliver (1994) suggest that customer satisfaction or dissatisfaction – a “cognitive or affective reaction” – emerges
The Influence of Service Quality of Mobile Phone on Customer Satisfaction in Malaysia: A Students’ Feedback Survey: 79-97 as a response to a single or prolonged set of service encounters. Satisfaction is a “post consumption” experience which compares perceived quality with expected quality, whereas service quality refers to a global evaluation of a firm’s service delivery system (Anderson & Fornell, 1994; Parasuraman et al., 1988). Using experimental design and qualitative techniques, in one of the few empirical studies of this relationship, Iacobucci et al. (1995) conclude that the key difference between service quality and customer satisfaction is that quality relates to managerial delivery of the service while satisfaction reflects customers’ experiences with that service. They argue that the quality improvements that are not based on customer needs will not result in improving customer satisfaction. There is a serious argument among the marketing scholars that quality is a dimension on which satisfaction is based upon and therefore, service quality is an antecedent of satisfaction (Dick & Basu, 1994; Anderson & Fornell, 1994; Iacobucci et al., 1995; Rust & Oliver, 1994. Similarly, Bolton and Drew (1994) point out “customer satisfaction depends on pre-existing or contemporaneous attitudes about service quality.” Hence, it has been suggested that improved service quality will result in a satisfied customer and suggest that to a large extent this relationship is intuitive (Bitner & Hubbert, 1994; Anderson & Fornell, 1994). Service quality and customer satisfaction constructs are popular in the services marketing literature during the last two decades or so. The prominence of these constructs is perhaps not unconnected with the increase in deregulation and competition among organizations and therefore, both the researchers and the industries pay greater attention to them (Iacobucci, Ostrom, & Grayson, 1995). Despite the popularity of the concepts of service quality and customer satisfaction, the constructs are frequently confused and used interchangeably by academicians and practitioners (Iacobucci et al.; Ostrom, & Grayson, 1995; Caruana, Money & Bertho; 2000). However, a number of researchers attempted to differentiate between the two intertwined constructs. For instance, some service quality researchers such as Parasuraman, Zeithaml & Berry (1985) and Bitner & Hubbert; (1993), observe that satisfaction is more specific and short-term customer evaluation, while quality is a more general and long-term evaluation. On the other hand, customer satisfaction scholars see quality as specific evaluation and a component of customer satisfaction which broader (Oliver, 1980). Based on the above explanation it could be said that the two constructs namely, customer satisfaction and service quality are not the same despite great similarity. 3.
Research method
Research framework and hypotheses
The model as diagrammed in Figure 1 is developed based on the works of Oliver (1980) and Parasuraman et al. (1988), the authors argue that service quality is made up of five different dimensions and that the quality of service is related to customer satisfaction. However, there are different views on which among the two variables influences the other and vice-versa. From Figure 1, it is hypothesised that the five dimensions of service quality namely: tangibility, reliability, responsiveness, assurance and empathy have significant and direct influences on customer satisfaction in the Malaysian mobile industry.
Independent Variables Mobile service quality 1. Tangible 2. Reliability
Dependent Variable Customer satisfaction
3. Responsiveness 4. Assurance 5. Empathy
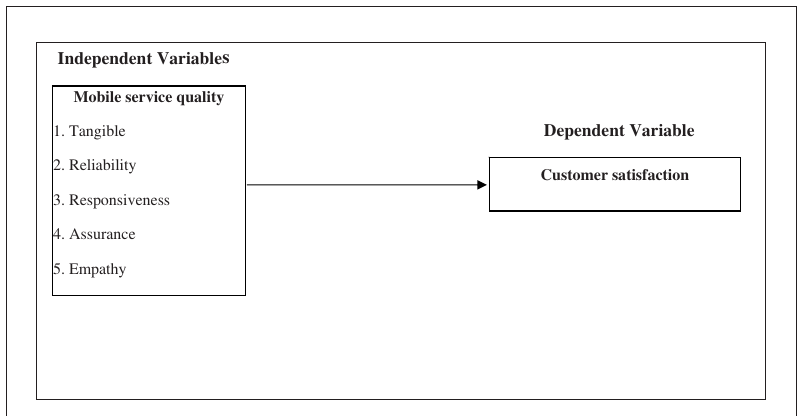
From the above theoretical framework, five hypotheses were developed for this research as follows: H1a: There is a significant relationship between tangibility and customer satisfaction H1b: There is a significant relationship between reliability and customer satisfaction H1c: There is a significant relationship between responsiveness and customer satisfaction H1d: There is a significant relationship between assurance and customer satisfaction H1e: There is a significant relationship between empathy and customer satisfaction 3.2
Sample and data
The population of this survey comprises of all the postgraduate students in Universiti Utara Malaysia main campus at Sintok. The population of the target respondents as at 2008 was 3012 (see appendix B). The sample of 350 students from across all the
The Influence of Service Quality of Mobile Phone on Customer Satisfaction in Malaysia: A Students’ Feedback Survey: 79-97
71 courses offered in UUM was selected based on the suggestion by Sekaran (1992). Purposive technique was utilized in the sampling because of the need to get data from the students that can provide it. The data collection instrument for the study is a questionnaire made up of three sections namely: respondents’ background information, service quality scale and satisfaction scale. A multiple-item scale of 20 questions was used to measure service quality and they were adopted from Parasuraman et al. (1988). On the other hand, 6 items adopted from Cronin and Taylor (2000), were used to measure customer satisfaction. In all the questions, 7-point Likert type rating scale was used. Both the descriptive and inferential statistical techniques were used in the process of data analysis and the results were tabulated. Specifically, reliability tests and regression analysis was conducted using Statistical Package for Social Science (SPSS) version 12 for windows. 4.
Results
The five dimensions were analyzed using Cronbach’s shows the internal consistencies for each dimension (refer to Table 1). The reliability scores for the three variables extracted were high. The higher the score, the more reliable the generated scale is. Nunally (1978) has indicated 0.7 to be an acceptable reliability coefficient but lower thresholds are sometimes used in the literature. The values of Cronbach show that the measures used in the study are reliable.
| Variable |
| Service quality |
| 4.1 |
| Dimensions |
| Number of items |
| Cronbach |
| Tangibility |
| 0.880 |
| Reliability |
| 0.802 |
| Responsiveness |
| 0.719 |
| Assurance |
| 0.845 |
Empathy
Importance of the five dimensions on overall service quality
The results of the service quality serve as a benchmark to the management regarding the significance of the service quality dimensions in influencing customer satisfaction of mobile service. Table 2 presents the mean of five dimensions in service quality of mobile service provider based on the mean scores of their expectations. The tangibility dimension mean score of 5.4094 was ranked the most important dimension. This was followed by the reliability dimension at 5.0870. The least important dimension was empathy with a mean score of 4.5556. The results are inconsistent with the findings of Parasuraman et al. (1991b) for they found that tangibility is the least important dimension across various service providers. Hence, this is contrary to the findings of this study. This variation in findings could perhaps be explained due to the difference in the respondents’ culture and also the nature of the service sectors on which the researches are carried out. 4.2
Descriptive statistics
| Tangibility | Reliability | Responsiveness | Assurance | Empathy | ||
|---|---|---|---|---|---|---|
| Mean | 5.4094 | 5.0870 | 4.9393 | 4.9860 | 4.5556 | |
| Median | 5.3333 | 5.2500 | 5.0000 | 5.0000 | 4.5000 | |
| Mode | 6.00 | 5.50 | 5.00 | 5.40 | 4.00 | |
| Std. Deviation | 1.07978 | 0.85039 | 0.80080 | 0.85241 | 1.042929 | |
| Variance | 1.166 | 0.723 | 0.641 | 0.727 | 1.101 | |
| Range | 5.00 | 4.75 | 5.00 | 5.40 | 5.75 | |
| Minimum | 2.00 | 2.00 | 2.00 | 1.60 | 1.00 | |
| Maximum | 7.00 | 6.75 | 7.00 | 7.00 | 6.75 | |
Service quality of mobile service provider and customer satisfaction
Table 3 presents the regression results. The adjusted R² of 0.435 indicates 43.5 percent of variance in customer satisfaction can be predicted by the service quality dimensions of mobile service provider. The positive coefficient for the dimensions: tangibility, reliability, responsiveness and assurance were found to be statistically significant, suggesting increasing level of satisfaction. However, the empathy dimensions had negative coefficient, meaning it leads to decreasing level of satisfaction, especially in the case of the service to organization. In other words, higher empathy resulted in decreasing client satisfaction. Hence, hypotheses H1a, H1b, H1c and H1d are supported; while hypothesis H1e is rejected. Overall, this study concludes that mobile service provider service quality affects client satisfaction.
The Influence of Service Quality of Mobile Phone on Customer Satisfaction in Malaysia: A Students’ Feedback Survey: 79-97
| Model | Unstandardized Coefficients | Standardized | |||
|---|---|---|---|---|---|
| Coefficient | |||||
| Beta | t | Sig. | |||
| B | Std.Error | ||||
| 1 {Constant} | 0.855 | 0.306 | 2.791 | 0.006 | |
| Tangibility | 0.258 | 0.060 | 0.257 | 4.327 | 0.000 |
| Reliability | 0.103 | 0.085 | 0.081 | 1.213 | 0.226 |
| Responsiveness | 0.180 | 0.096 | 0.133 | 1.866 | 0.063 |
| Assurance | 0.458 | 0.085 | 0.360 | 5.401 | 0.000 |
| Empathy | -0.158 | 0.053 | -0.153 | -2.991 | 0.003 |
| R²: | 0.443 | ||||
| Adjusted R²: | 0.435 | ||||
| F-Statistic: | 53.472 | ||||
Discussion and conclusion
The tangibility dimension was ranked the most important dimension, followed by the reliability dimension, with the least important dimension being the empathy. Such results are inconsistent with the findings by Parasuraman et al., (1991b) in their studies on other service firms. The high ranking of the reliability dimension suggests that mobile service providers deliver the services as promised and accurately. Hence, the appearance of mobile service provider facilities is also an important factor while delivering the service. Therefore, in order to fulfill the needs of mobile customers, mobile service provider must make sure that services delivered are reliable at all times. As for the important of tangibility dimension, it is suggested that the mobile service providers should pay more attention to the physical cues such as office premises that customer usually used in service quality evaluation.Findings in this study also reveal that assurance and responsiveness dimensions have significant effects on customer satisfaction. Consequently, the mobile services providers need not only to be more courteous to their customers but also to have knowledgeable staff more especially customer care personnel. Similarly, the importance of responsiveness suggests that the mobile service providers should also pay attention to the prompt service delivery and willingness to help customers when the need arises.
However, empathy was found to have no significant influence on the customer satisfaction with regards to the services delivered by mobile service providers. This is probably due to the nature of mostly impersonalized service delivery apparent in the mobile communication industry. Wireless service is normally standardized and delivered automatically, thus, caring and individualized attention might be less important. The results of the study are however, consistent with the findings by Cronin and Taylor (1992) whereby, customers do not necessarily purchase the highest quality service; they may also weigh convenience, price and availability factors. The customer’s personal experience with the service provider (that is, courtesy, waiting time, empathy, responsiveness, and so on) also have impact on customer satisfaction (Nowak 1997). 4.5
Future research
Limiting the scope of this study to only one subsector of the service industry namely mobile phone is considered as a limitation of this study. It is therefore, suggested that future research should test the model to other service industries such as banking and restaurant among others. Similarly, the study did not extend to the consequences of customer satisfaction which may be of great interest to marketers as well as researchers in service industry.
References
- Albrecht, C., Zemke, R. (1985). Service America, Dow Jones-Irwin, Homewood, IL.
- Anderson, E.W., & Fornell, C. (1994). Customer satisfaction research prospectus. In Rust R.T., & Oliver R.L (Eds.). Service quality: New directions in theory and practice. 214-268. Thousand Oaks, C: Sage Publications.
- Andreassen, T.W. & Bredal, D. (1996). Kundepleie i Praksis. Relasjonsmarkedsføring på forbrukermarkedet, AdNotam Gyldendal Forlag as, Oslo.
- Armistead, C. (1990). Service operations strategy: framework for matching the service operations task and the service delivery system. Marketing Science, 12 (2), 6-17.
- Aydin, S. Ozer, G. & Arasil, O. (2005). Customer loyalty and the effect of switching costs as a moderator variable: A case in the Turkish mobile phone market. Marketing Intelligence & Planning, 23 (1), 89-103
- Bearden, W.O., Teel, J.E. (1983). Selected determinants of consumer satisfaction and complaint reports. Journal of Marketing Research, 20, 21-8.
- Bitner, M.J., Booms, B.H., Tetreault, M.S. (1990). The service encounter diagnosing favourable and unfavourable incidents. Journal of Marketing, 54 (1), 71-84.
- Bitner, M.J., Hubbert, A.R. (1994). Encounter satisfaction versus overall satisfaction versus quality. In Rust, R.T., Oliver, R.L. (Eds),Service Quality: New Directions in Theory and Practice. Sage Publications, London, Thousands Oaks, CA, 311-29.
- Bolton, R.N, Drew, J.H (1991). A multistage model of customers’ assessments of service quality and value. Journal of Consumer Research, 17, 375-84.
- Carlzon, J. (1987). Moments of Truth, Ballinger Publishing, Cambridge, MA.
- Cronin, J.J, Taylor, S.A. (1992). Measuring service quality: are-examination and extension. Journal of Marketing, 56, 55-68.
- Dabholkar, P.A, Thorpe, D.I., Rentz, J.O. (1996). A measure of service quality for retail stores: Scale development and validation. Journal of the Academy of Marketing Science, 24 (1), 3-17
- Day, G.S. (1994). The capabilities of market-driven organizations. Journal of Marketing, 58 (4), 37-52.
- Dick, A.S, Basu, K. (1994). Customer loyalty: toward an integrated conceptual framework. Journal of the Academy of Marketing Science, 22 (2), 99-113.
- East, R. (1997). Consumer Behaviour: Advances and Applications in Marketing, Prentice-Hall, London.
- Fournier, S., Mick, D.G. (1999). Rediscovering satisfaction. Journal of Marketing, 63 (4), 5-23.
- Fornell, C. (1991). A national barometer: The Swedish experience. Journal of Marketing. 56(1), 6-21.
- Gronroos, C (1984). A service quality model and its market implications. European Journal of Marketing, 18 (4), 36-44.
- Herbig, P., Genestre, A. (1996). An examination of the cross-cultural differences in service quality: the example of Mexico and the USA. Journal of Consumer Marketing, 13 (3), 43-53.
- Heskett, J.L, Sasser, W.E, Schlesinger, L.A (1997). The Service Profit Chain, Free Press, New York, NY.
- Homburg, C., Koschate, N., Hoyer, W.D. (2006). The role of cognition and affect in the formation of customer satisfaction: a dynamic perspective. Journal of Marketing, 70 (7), 21-31.
- Iacobucci, D., Ostrom, A., Grayson, K. (1995). Distinguishing service quality and customer satisfaction: the voice of the consumer. Journal of Consumer Psychology, 4 (3), 277-303.
- Jamal, A. (2004). Retail banking and customer behaviour: a study of self concept, satisfaction and technology usage. International Review of Retailing, Distribution and Consumer Research, 14 (3), 357-79.
- Jones, T.O., Sasser, E.W. (1995). Why satisfied customers defect. Harvard Business Review, November-December, 73 (6), 88-99.
- Kohli, A.K., Jaworski, B.J. (1990). Market orientation: the construct, research propositions, and managerial implications. Journal of Marketing, 54, 20-35.
- LaBarbera, P.A., Mazursky, D. (1983). A longitudinal assessment of consumer satisfaction/dissatisfaction: the dynamic aspect of the cognitive process. Journal of Marketing Research, 20 (4), 393-404.
- Lehtinen, U, Lehtinen, J.R (1982). Service quality – a study of dimensions. Service Management Institute, Helsinki, unpublished working paper, 439-60.
- Lewis, R.C, Booms, B.H (1983). The marketing aspects of service quality. In Berry, L.L., Shostack, G., Upah, G (Eds), Emerging Perspectives in Service Marketing, American Marketing Association, Chicago, IL, 99-107.
- Lovelock, C.H., Patterson, P.G., Walker, R.H. (2004). Services Marketing: Australia and New Zealand. Pearson Education Australia, French’s Forest.
- Malaysian Communication and Multimedia Commission (2004). Statistical Brief, available at: www.cmc.gov.my.
- Mano, H., Oliver, R.L. (1993). Assessing the dimensionality and structure of the consumption experience: Evaluation, feeling and satisfaction. Journal of Consumer Research, 20 (3), 451-466.
- Meuter, M.L., Ostrom, A.L., Roundtree, R.I., Bitner, M.J. (2000). Journal of Marketing, 64 (3), 50-64.
- Nowak, L. I. (1997). Partnering relationships between banks and their research firms: The impact on quality. International Journal of Bank Marketing 15(3) 83-90.
- Nunally, J.C. (1978). Psychometric Theory, 2nd ed., McGraw-Hill, New York, NY.
- Oliver, R.L., DeSarbo, W.S. (1988). Research determinants in satisfaction judgments. Journal of Consumer Research, 14, 495-507.
- Oliver, R.L. (1980). A cognitive model of the antecedents and consequences of satisfaction decisions. Journal of Marketing Resarch, 17 (4), 460-9.
- Parasuraman, A., Zeithaml, V., Berry, L. (1985). A conceptual model of service quality and its implications for future research. Journal of Marketing, 49, 41-50.
- Parasuraman, A, Zeithaml, V.A, Berry, L.L. (1988). SERVQUAL: a multiple-item scale for measuring consumer perceptions of service quality. Journal of Retailing, 64 (1), 12-40.
- Parasuraman, A., Berry, L.L., Zeithaml, V.A. (1991b). Refinement and reassessment of the SERVQUAL scale. Journal of Retailing, 67, No.Winter, 420-50.
- Parasuraman, A., Zeithaml, V.A., Berry, L.L. (1994). Alternative scales for measuring service quality: a comparative assessment based on psychometric and diagnostic criteria. Journal of Retailing, 70 (3), 201-30.
- Peterson, R.A, Wilson, W.R (1992). Measuring customer satisfaction: fact and artifact. Journal of the Academy of Marketing Science, 20, 61-71.
- Pizam, A., & Ellis, T. (1999). Customer satisfaction and its measurement in hospitality enterprises. International Journal of Contemporary Hospitality management, 11(7), 326-338.
- Rust, R.T., Oliver, R.L. (1994). Service quality insights and managerial implications from the frontier. In Rust, R.T., Oliver, R.L. (Eds), Service Quality New Directions in Theory and Practice, Sage, Thousand Oaks, CA.
- Sekaran, U. (1992). Research methods for business a skill-building approach (2nd ed.). New York: John Wiley
- Spreng, R.A, Mackoy, R.D (1996). An empirical examination of a model of perceived service quality and satisfaction. Journal of Retailing, 72 (2), 201-14.
- Taylor, S.A., Baker, T.L. (1994). An assessment of the relationship between service quality and customer satisfaction in the formation of consumers’ purchase intentions. Journal of Retailing, 70 (2), 163-78.
- Westbrook, R.A., Oliver, R.L. (1991). The dimensionality of consumption emotion patterns and customer satisfaction. Journal of Consumer Research, 18, 84-91.
- Zeithaml, V.A. (1987). Defining and Relating Prices, Perceived Quality and Perceived Value, Marketing Science Institute, Cambridge, MA.
- Zeithaml, V.A (1988). Consumer perceptions of price, quality and value: a means end model and synthesis of evidence. Journal of Marketing, 52, 35-48.