International and local students' satisfaction of healthcare services
- Management Department, Faculty of Management and Human Resources Development, Universiti Teknologi Malaysia
Journal of Business Management and Accounting 1(2) (2011) · https://doi.org/10.32890/jbma2011.1.2.8909
Abstract
This research aims to measure the international and local students’ satisfaction toward university healthcare services provided by one public university. The study determines the students’ expectations, perceptions and the gap between them based on the five dimensions of service quality of a modified SERVQUAL instrument. A total of 273 respondents answered the questionnaires consisted of 134 international students and 139 local students. The study shows that both groups of students were generally not satisfi ed with the services provided by the healthcare center. Dissatisfaction among the International students was more closely related to the assurance-dimension; while the local students were dissatisfi ed with the reliability-dimension. Furthermore, the results show significant differences between the international and local students’ satisfaction with regard to assurance-dimension only.
Keywords: Students’ satisfaction, Students’ expectations, Students’ perceptions, Health care, Gap scores, SERVQUAL
1Introduction
Service quality is different from product quality in that services are intangible. Consumers cannot see or touch them. Therefore, it is very difficult for an organization to pinpoint what characteristics or traits of its service quality are more important to customers and how the organization is meeting its customers’ demand for service quality. In the last decade, many researchers (e.g. Reidenbach and Sandifer-Smallwood, 1990; Babakus and Mangold, 1992; Taylor and Cronin, 1994; Anderson, 1995; Anderson and Zwelling, 1996; Lam, 1997; Sewell, 1997; Dean, 1999) have attempted to quantify healthcare service quality to provide benchmarks to organizations and consumers, which may help both parties to better understand expectations and perceptions regarding service quality.1
* *Corresponding author. Tel: 0060178439541 Email address: aayedalmansory@gmail.com
The difference between Customers’ expectations and perceptions is defined as a service gap which is the basis of the most recent service quality research (Gronroos. 1984; Parasuraman, Zeithaml and Berry (1988); Lewis, 1989, Lewis and Mitchell, 1990). Measurement of customer perceptions of service quality is necessary to evaluate the impact of quality improvement activities. Furthermore, management can better direct financial resources to improve the clinic operations in the areas that affect the customer perceptions most (Anderson, 1995). Such evaluation of healthcare service quality and students satisfaction is essential in today’s competitive situation among the universities, especially for those universities which seek to be among the best in its field. Patient satisfaction is one important measurable aspect of medical interactions (Donabedian, 1988). The rationale for measuring satisfaction is clear: consumers will continue to use medical services with those they are satisfied. Thus, measuring patient satisfaction may benefit medical providers by furnishing them with guidance about how to improve their services and maintain their livelihood. Furthermore, patient satisfaction indicator may also provide a direct or indirect indication of the outcome of medical care (Cleary and McNeil, 1988).
One of the most critical issues in the comprehensive quality system for the universities, especially for international universities, is the quality of healthcare services and the satisfaction derived from these services by the students from different nationalities. The issue of healthcare quality and the students’ healthcare satisfaction has drawn considerable attention from both academics and practitioners over the past few years (Anderson, 1995).
In attempts to measure the quality of healthcare services provided by university health centre and the student’s satisfaction with these services, the healthcare providers must understand the needs’ characteristics of different groups and cultural values for different students, so they can better serve these students. This study seeks to identify student expectations and perception of healthcare service and the level of the student’s satisfaction. Furthermore, it aims to identify if there are any signi ficant differences between local and international students’ satisfaction. Based on the previous section, this research aims to achieve the following objectives:
a) Assess the level of the ideal healthcare services expectations for the local and international students, in accordance to the five dimensions of the service quality (Tangibles, Reliability, Responsiveness, Assurance, and Empathy), and identify if there are any significant differences between local and international students’ expectations. b) Assess the level of university healthcare services perceptions for the local and international students, in accordance to the five dimensions of the service quality (Tangibles, Reliability, Responsiveness, Assurance, and Empathy), and identify if there are any significant differences between local and international students’ perceptions.
c) Determine the satisfaction level of university healthcare services for the local and international students’ in accordance to the five dimensions of the service quality, and identify if there are any significant differences between satisfactions. d) Identify if there are any significant differences of the gap scores among the students according to their demographic variables.
2Dimensions of service quality
Parasuraman, Zeithaml and Berry (1985, p.47) listed ten determinants of service quality that can be generalized to any type of services. Then through factor analysis, they narrowed the list to five dimensions as following:
| No | Dimension | Definition |
|---|---|---|
| 1. Tangibles | Appearance of the organozation’s facilities, employees, equipment, and communication materials | |
| 2. Reliability | Delivering the promised performance dependably and accurately. | |
| 3. Respo nsiveness | Willingness of the organization to provide prompt service and help customers. | |
| 4. Assurance (competence, | Ability of an organization’s employees to inspire trust | |
| courtesy, credibility, | \&confi dence in the organization through their knowledge | |
| security) | &courtesy | |
| 5. Empathy (access, | Personalized attention given to a customer | |
| communication, | ||
| understanding the customer) |
Source: Parasuraman et al. (1988, p.23) and Parasuraman, Berry and , Zeithaml) (1991, p.41)
3Gap model
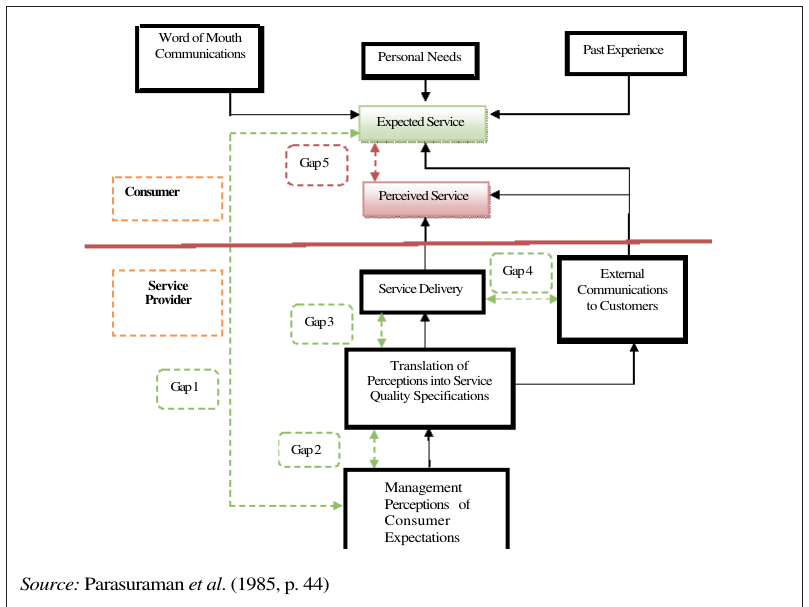
Gap model is a tool that is commonly used to describe service quality. People base their service quality judgments on the gap that exists between their perceptions of what happened during the service transaction and their expectations of how the service transaction should have occurred. When these gaps exist, quality is compromised (Murphy, 1993). Therefore, a quality control strategy in services is used to narrow and eventually close these gaps. Parasuraman et al. (1985) defi ned service quality in five dimensions – tangibles, reliability, responsiveness, assurance, and empathy. The model International and local students’ satisfaction of healthcare services: 49-70 4 suggested service quality as the gap between customer’s expectations (E) and their perception of the service provider’s performance (P). Hence, the service quality scores (Q) can be measured by subtracting customer’s perception score from customer’s expectations score. (Q = P – E). Parasuraman et al. (1985) developed a service quality model (see Figure 1) based on the gap analysis.
4Healthcare service quality dimensions
The most prominent several model of service quality is Parasuraman et al.’ s (1985; 1988) SERVQUAL. The extent of modification or addition to the SERVQUAL dimensions varies from researcher to researcher (Rose, Abdul and Ng (2004). For example, Lim and Tang (2000) added “accessibility/affordability”; and Tucker and Adams added (2001) “caring” and “outcomes”. While Johnston (1995) saw the need to increase SERVQUAL to 18 dimensions, Reidenbach and Sandifer-Smallwood (1990) deemed it necessary to reduce it from ten to seven dimensions. Tomes and Ng (1995) regrouped them into “empathy”, “understanding of illness”, “relationship of mutual respect”, “dignity”, “food”, “physical environment” and “religious needs”. The service quality dimensions available from the literature can be summarized as follows (see Table 2).
Word of Mouth Communications Personal Needs Past Experience
Expected Service
Gap 5
Consumer Perceived Service
                                                                                               Gap 4       External
                          Service                                     Service Delivery                 Communications
                          Provider                                                                      to Customers
                                                        Gap 3
Translation of Gap1 Perceptions into Service Quality Specifications
Gap 2
Management Perceptions of Consumer Expectations
Source: Parasuraman et al. (1985, p. 44)
| Author/researcher | Country | Service quality dimensions |
|---|---|---|
| Parasuraman et al. | USA | Tangibles, reliability, responsiveness, communication, |
| (1985) | credibility, security, competence, courtesy, understanding, access | |
| Parasuraman et al. | USA | Tangibles, reliability, responsiveness, assurance, empathy |
| (1988) | USA | Patient confidence, empathy, quality of treatment, waiting |
| Reidenbach and | time, physical appearance, support services, business | |
| Sandifer-Smallwood | aspects | |
| (1990) | ||
| Cunningham (1991) | USA | Clinical quality, patient-driven quality, economic-driven Quality |
| Ovretveit (2000) | Sweden | Client quality, professional quality, management Quality |
| Tomes and Ng (1995) | UK | Empathy, understanding of illness, relationship of mutual respect, religious needs, dignity, food, physical environment |
| Andaleeb (1998) | USA | Communication, cost, facility, competence, demeanor |
| Gross and Nirel (1998) | Ireland | Accessibility, structure, atmosphere, interpersonal |
| Carman (2000) | USA | Technical aspect (nursing care, outcome and physician care), accommodation aspect (food, noise, room temperature, cleanliness, privacy, parking |
| Camilleri and | Malta | Professional and technical care, service personalization, |
| O’Callaghan (1998) | New | price, environment, patient amenities, accessibility, catering Reliability |
| Walters and Jones | New Zealand | Security, performance, aesthetics, convenience, economy, |
| (2001) | ||
| Source: Rose et al. (2004, p. 148) |
4.1International student and healthcare services
Accompanying the growth in international student enrolments in Malaysian universities there has been an increase in the awareness of the range of student needs that must be met (Russell, Thomson & Rosenthal (2007). One aspect of these concerns is the utilization of international students for the university services, in particular, healthcare services. The process of cultural adaptation for international students is said to be a stressful one (Russell et al., 2007). Explanations of low usage of university healthcare services by international students are usually given in cultural terms (Russell et al.,
2007). Although international students have need of help during the adjustment process, particularly counseling help, they make less use of the university services than expected (Russell et al., 2007).
Three types of benchmark for evaluating the level or appropriateness of usage have been used. The first examines the international against the domestic student use. Okorocha (cited in Bradley 2000), for example, found that UK domestic student usage was higher. There appears to be no reason to assume that the domestic student usage rate is the more appropriate. The second evaluates a usage by different ethnic groups within the domestic student population. For example, Asian American students were found to use counseling services less than Caucasian American students (Kearney, Draper and Baron (2005).). This evidence is only indirectly related to patterns of international student help-seeking. The third examines help-seeking in relation to students’ perceived need for help. For example, a significant gap was found between Asian international students’ perceived need for medical help and seeking of treatment (Fallon and Barbara 2005). This criterion provides a relevant basis for evaluating help-seeking usage.
There is also evidence that international students with prior experience of counseling are more positive in their attitudes than those without (Kearney et al., 2005; Kilinc and Granello, 2003), another possible indicator of satisfaction. One factor that needs to be taken into account is whether international and domestic students seek help for different types of problem. Evidence regarding satisfaction with medical services is also sparse. Pre-tertiary international students at an Australian university, almost all Asians, rated their satisfaction with doctors’ care, understanding, explanations and treatment at a little above the midpoint of the scale (Fallon and Barbara, 2005). At the same university, both undergraduate and graduate international students tended to be less satisfied than their domestic counterparts with university health services (Daroesman, Looi, Smyth, and Douglas (2004).
4.2Students’ satisfaction in the Universities healthcare centers
Anderson (1995) assessed the quality of service and measurement of customer perceptions of service quality provided by a public university health clinic (the University of Houston), based on the five dimensions of service quality: tangibles, reliability, responsiveness, assurance and empathy, developed by Parasuraman et al. (1988). Anderson (1995) concluded that “students do not seem to care as much about tangibles and empathy as they do about reliability, assurance, and responsiveness”.
Canel and Anderson (2001) identified the student expectations and perceptions of service quality delivered by university health care centre. Furthermore, they also determined the differences of the perceptions between students and employees in the university. SERVQUAL instrument was used in this study with approximately 500 respondents of university students. The result showed that service dimensions crucial to patient satisfaction are patient confidence, staff competence, interest in the patient’s well-being, and a sense of security. The expectations of the students validated these findings with the majority of students strongly agreeing that staff members should be knowledgeable and willing to help. Likewise, students indicated that they expect to feel safe with interactions, should be told when services will be performed and that the clinic’s equipment should be up-to date. It is also obvious that students’ perception of the center’s performance does not match their expectations.
Bakar, Akgu¨n and Al Assaf (2007) assessed patient attitudes regarding important aspects of service dimensions using SERVQUAL in Turkish University Hospital. This study consisted of 550 randomly chosen patients. The results showed that “the patients’ perceived scores were higher than expected for an ordinary hospital but lower than expected for a high-quality hospital” (Bakar et al., 2007). “Young patients had a high- expected service score gap and a low adequate service score difference and highly educated patients had a high-expected service score difference” (Bakar et al., 2007). Thus, the patient perception for all SERVQUAL statements in this study was lower than that for a perfect hospital but higher than that for an ordinary hospital. “The most important factor in the relationship between patient perceptions and expectations is patient expectations, when the latter was high, perceptions may be lower. Furthermore, the lowest expected service scores were responsiveness and reliability dimensions” (Bakar et al., 2007).
Owusu-Frimpong, Nwankw and Dason (2010) explored patients’ satisfaction with access to treatment in both the public and private healthcare sectors in London. Qualitative and quantitative methods were employed to determine patients’ levels of satisfaction. A semi-structured face -to-face non-probability quota sampling and a probability sample drawn from multistage cluster sampling methods were employed. The results revealed varying access experiences among public and private care users. Public, as opposed to private, healthcare users experience unsatisfactory outcomes in relation to service climate factors (e.g. getting attention from doctors, time taken to get appointments, access to core treatment and opening hours). Thus, Access-to-care problems are significant and need to be addressed by managers and healthcare providers in order to improve the quality of service delivery and patient satisfaction. Private care users fare better than public users in obtaining medical care at short notice, having more agreeable opening hours for treatment and getting appointments for treatment with less difficulty.
Nekoei-Moghadam and Amiresmaili’s (2011) study investigated the service quality gap model in the service sector as one of the common tools for quality evaluation. The study considered as a descriptive study that was carried out through a cross-sectional method in 2008. The participants of this study were patients who had been referred to Kerman University of Medical Sciences hospitals. The sample comprised 385 patients. The data were collected by SERVQUAL as a standard questionnaire, and data analysis was carried out on 385 completed questionnaires. In all five dimensions of quality, a gap was observed between patients’ perceptions and expectations as follows: Assurance: 21.28, Empathy: 21.36, Responsiveness: 21.80, Tangibles: 21.86 and Reliability: 21.69. A paired T-test showed that the differences between quality perceptions and expectations are significant (p value, 0.05). Based on the findings of this research, the hospitals in the study did not meet the expectations of patients and were unable to provide health care services according to patients’ expectations. Hence rearranging the service delivery and deploying better facilities and equipment in order to decrease the gap between patients’ perceptions and expectations may be helpful.
Suki, Lian and Suki (2011). investigated whether patients’ perceptions exceed expectations when seeking treatment in private healthcare settings in the Klang Valley Region of Malaysia. The study survey was conducted among 191 patients to measure service quality of the private healthcare setting in Malaysia using SERVQUAL 5 dimensions model by Parasuraman et al. and three additional dimensions of the human element. The results revealed that the customers’ perceptions did not exceed their expectations, as they were dissatisfi ed with the level of healthcare services rendered by private healthcare settings in that they felt that the waiting time of more than an hour to receive the service was excessive and when there was a problem, the healthcare provider did not provide a response fast enough.
5Research Methodology
In carrying out this research, a quantitative approach was considered as the most appropriate method to assess the gaps between customer expectations and perceptions as Zeithaml et al., (2006) mentioned. More specifically, in order to measure service quality for the university health centre from the students’ perspective, a modi fied version of SERVQUAL scale (Prasuraman et al., 1988: 1991) was considered to be the most suitable tool. This selection was based on two reasons. Firstly, this scale has been applied to the healthcare fi eld in numerous studies across different countries (Babakus and Mangold 1992, in the USA; Lam 1997, in Hong Kong; Fuentes 1999, in Spain; Lim and Tang 2000, in Singapore; Jabnoun and Chaker 2003, in the UEA; Sohail 2003, in Malaysia; Mostafa 2005 in Egypt). Secondly, the overwhelming majority of service quality studies in the healthcare domain had shown SERVQUAL to be an accurate and valid measure of service quality (Babakus and Mangold, 1992; Dean, 1999; Lam, 1997; Reidenbach and Sandifer-Smallwood, 1990; Taylor and Cronin, 1994; Vandamme and Leunis, 1993; Wong, 2002).
The design of the questions followed the guidelines provided by Parasuraman et al (1991) for adapting the SERVQUAL instrument, which entails a standard set of questions about the fi ve principal dimensions of service quality. Students of one public university were the target of this study and the questionnaires are distributed to the sample size of (378). According to Sekaran (1992) “the convenience sampling is the appropriate method for ease and quickness in surveying the sample”. A 95% confidence
(continued) International and local students’ satisfaction of healthcare services: 49-70 10 level is the conventionally accepted level for most business research, most commonly expressed by denoting the signi fi cance level as p ≤ .05. Practically, to achieve the confi dence level of 95%; about 378 respondents are the appropriate sample size if the population is 26,425 (Sekaran, 1992: 253). Moreover, this study is a comparative study, because the sample size was divided into two equal parts: 189 for local students and 189 for international students. A pre-test study was executed also to eight local students and seven international students.
Traditional 5-point Likert scale was employed in this study, where “5” is extremely positive, and “1” is “strongly disagree”. The close-ended questions (related to expectations and perceptions statements) were analyzed using Cronbach’ s alpha for reliability (all Cronbach’ s alpha values were accepted). Furthermore, Kaiser- Meyer-Olkin measure and Bartlett’s Test of Sphericity for sampling adequacy were shown in accepted results across all values. Descriptive analysis consisting of mean scores, frequency and standard deviations were carried out to determine the students’ expectation and perception levels. Satisfaction gap was calculated and computed as the following: (Gap Score = Perception Score – Expectation Score). T-test and one-way analysis of variance (ANOVA) were carried out to examine if there were signifi cant differences between local and international students toward university health centre services and all the data were verifi ed to ensure its accuracy, and test for signifi cance was set at p ≤ .05.
6Results
A total of 273 respondents answered the questionnaires with response rate of 72%, 139 for local students with response rate of 73.6% and 134 for international students with response rate of 72%. The demographic variables were analyzed to determine the overall view of the respondents’ profi les. The summary of the respondents’ profi les is illustrated in Table 3:
| Demographic Profi le | Local Students | International Students | Total | ||||
|---|---|---|---|---|---|---|---|
| Frequency | % | Frequency | % | Frequency | % | ||
| Respondent’s Age | |||||||
| 18-24 | 122 | 88% | 35 | 26% | 157 57.5% | ||
| 25-29 | 12 | 8.5% | 52 | 39% | 64 23.5% | ||
| 30-34 | 4 | 2.5% | 43 | 25% | 38 14% | ||
| Above 35 | 1 | 1% | 13 | 10% | 14 5% | ||
| Demographic Profi le | Local Students Frequency % | International Students Frequency | % | Frequency | Total % | ||
| Respondent’s Gender | |||||||
| Male | 98 70% | 123 | 92% | 221 | 81% | ||
| Female | 41 30% | 11 | 8% | 52 | 19% | ||
| Education Level | |||||||
| Undergraduate | 97 70% | 31 | 23% | 128 | 47% | ||
| Master | 42 30% | 73 | 55% | 115 | 42% | ||
| Ph D | 0 0 | 30 | 22% | 30 | 11% | ||
| Nationality | |||||||
| Malaysian | 139 100% | - | - | - | - | ||
| Arab | - - | 89 | 67% | - | - | ||
| Africa | - - | 12 | 9% | - | - | ||
| Asian | - - | 27 | 20% | - | - | ||
| Missing | - - | 6 | 4% | - | - | ||
| Student’s Status | |||||||
| 1 Semester | 21 15% | 22 | 16% | 43 | 16% | ||
| 2-4 Semester | 65 47% | 93 | 70% | 158 | 58% | ||
| 5 and more | 53 38% | 19 | 14% | 72 | 26% | ||
6.1Level of the ideal healthcare services expectations
6.1.1Relationship between local & international students’ expectations
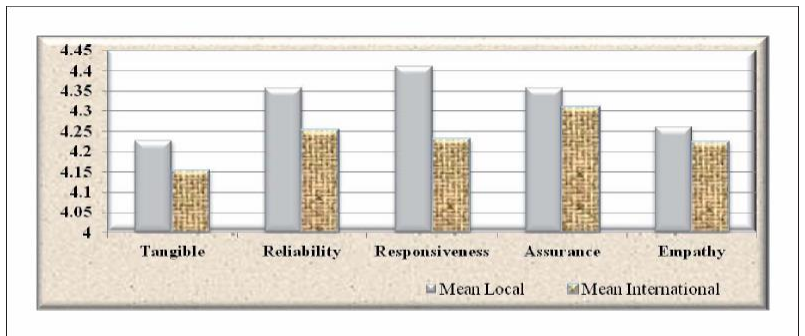
All the five expectations’ dimensions achieve an average mean score of more than four for both local and international students on a scale of one to five (with “1” indicating “Strongly disagree and “5” indicating “Strongly agree”); and this refl ects the high expectations for both students (see Figure 2). The highest mean differences between students come mainly from responsiveness then reliability dimensions. The lowest mean differences come from empathy then assurance dimensions. Furthermore, the high mean difference in responsiveness dimension will re fl ect on the mean scores signifi cant differences which will present in the following sub-section.
6.1.2Mean scores signi Þ cant differences of students’ expectations
The displayed results in Table 4 indicate that there are no statistically signi fi cant differences in the expectations level between local and international students for ideal health services in four dimensions of service quality “tangible“, ”reliability”, “assurance “, and “empathy “, for which of them have got (sig. ≥ 0.05). Only “Responsiveness” shows a signifi cant difference of (p-value = 0.043), and thereby this International and local students’ satisfaction of healthcare services: 49-70 59 dimension provides us an indication for a gap score in the expectations’ levels between local and international students for the ideal healthcare services with regard to one dimension only. This signi Þ cant difference in responsiveness dimension is due to the highest mean differences between both local and international students with regard to this dimension, which was mentioned in the previous relationship between the mean scores expectations’ dimensions (see Figure 2).
| expectations | |||||
|---|---|---|---|---|---|
| The Dimensions | Local Students | International. Students | Sig. | ||
| Mean | St. Deviation | Mean | St. Deviation | t-test | |
| Tangible | 4.2284 | .69775 | 4.1530 | .75774 | .393 |
| Reliability | 4.3568 | .66278 | 4.2522 | .73696 | .218 |
| Responsiveness | 4.4101 | .65387 | 4.2313 | 79391 | .043* |
| Assurance | 4.3579 | .66625 | 4.3097 | .79068 | .586 |
| Empathy | 4.2619 | .69150 | 4.2239 | .72467 | .658 |
| Note: * SigniÞ cant level at p ≤ .05. | |||||
6.2Level of university healthcare services perceptions
6.2.1Relationship between local & international students’ perceptions
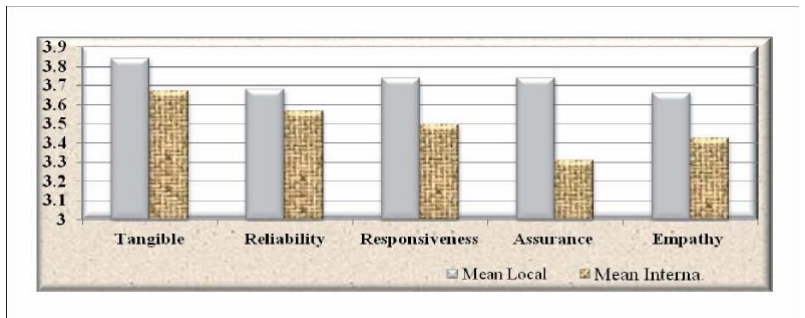
All the Þ ve perceptions’ dimensions for local students achieve an average mean score of more than 3.66 on a scale of one to Þ ve (with “1” indicating “Strongly disagree and “5” indicating “Strongly agree”), and this refl ects the high perceptions for them. However, it is a little different for international students’ perceptions, which achieve an average mean score of less than 3.66 with a medium perception level. The highest mean differences between students comes mainly from four-dimensions, which are: assurance, empathy, responsiveness and tangible dimensions in descending order. The lowest mean differences come mainly from reliability dimension (see Figure 3). The high mean difference in the previous four-dimensions will refl ect on the mean scores signifi cant differences which will be presented in the following sub-section.
6.2.2Mean scores signiÞ cant differences of students’ perceptions
The displayed results in Table 5 indicate that there are statistically signi fi cant differences in the students perceptions’ level for university health centre services in four dimensions of service quality “tangible” , “responsiveness”, “assurance “, and “empathy“ in which almost all of them have got (sig. ≤ 0.05). Only “reliability” shows no signifi cant difference in the students’ perceptions with (0.215). These results provide us an indication of existing big gap in the perceptions level between students toward university health centre services. However, the signi fi cant differences in previous dimensions are due to the highest mean differences between both local and international students with regard of those dimensions, which was mentioned in the previous relationship between the mean scores perceptions’ dimensions (see Figure 3).
6.3Satisfaction level of university healthcare services
6.3.1Local students’ satisfaction levels
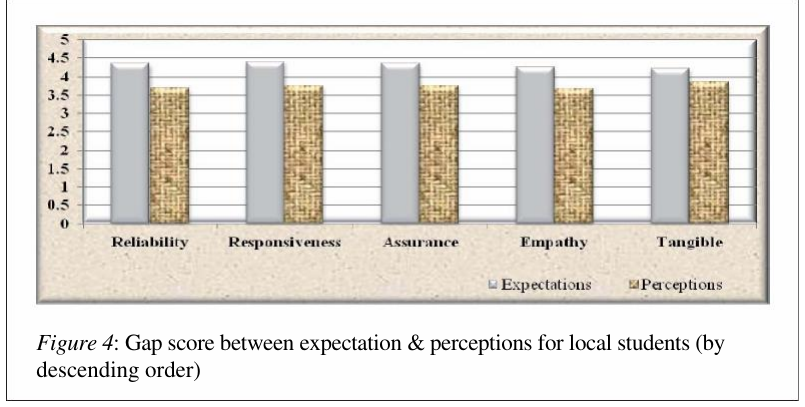
Figure 4 reveals that all quality dimensions of university health centre services with regard to local students’ perceptions do not meet the local students’ expectations. In other words, local students’ expectations exceeded their perceptions for the healthcare services provided by university health centre on all the SERVQUAL dimensions. On the other hand, based on the Þve quality dimensions for the local students’ satisfaction which are arranged in descending order of gap size, “reliability” ranked the highest gap scores with (-0.68), followed by “responsiveness” with a gap of (-0.67), “assurance” with a gap of (-0.62), and “empathy” with a gap of (-0.60) and “tangible ranked lowest gap scores with (-0.39).
| perceptions | |||||
|---|---|---|---|---|---|
| The Dimensions | Local Students | International Students | Sig. | ||
| Mean | St. D. | Mean | St. D. | t-test | |
| Tangible | 3.8417 | .63783 | 3.6754 | .65396 | .034* |
| Reliability | 3.6820 | .77751 | 3.5657 | .77032 | .215 |
| Responsiveness | 3.7410 | .74297 | 3.4963 | .85455 | .012* |
| Assurance | 3.7410 | .71438 | 3.3116 | .92248 | .000* |
| Empathy | 3.6647 | .71026 | 3.4254 | .81579 | .010* |
| Note: * SigniÞ cant level at p ≤ .05. | |||||
6.3.2International students’ satisfaction levels
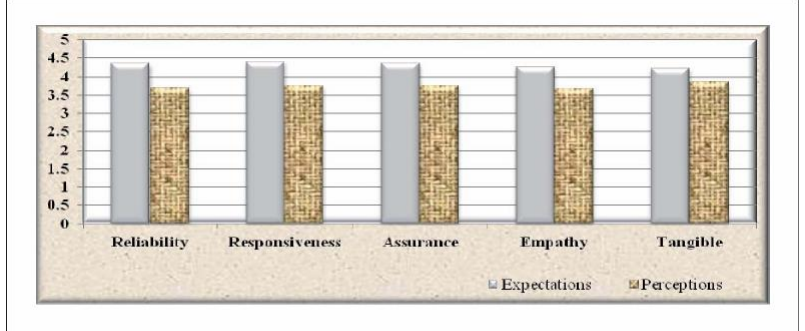
Figure 5 reveals that all quality dimensions of university health centre services with regard to international students’ perceptions do not meet the students’ expectations. In other words, international students’ expectations exceed their perceptions for the healthcare services provided by university health centre on all the SERVQUAL dimensions. The Þve quality dimensions for international students’ satisfaction in this part differ from the local students’ satisfaction in terms of the order of dimensions. “Assurance” ranks the highest gap with (-0.99), followed in the descending order by “empathy” with a gap of (-0.80), “responsiveness” with a gap of (-0.74), “reliability” with a gap of (-0.69) and “tangible ranked lowest gap scores with (-0.48).
6.3.3Relationship between local & international students’ satisfaction
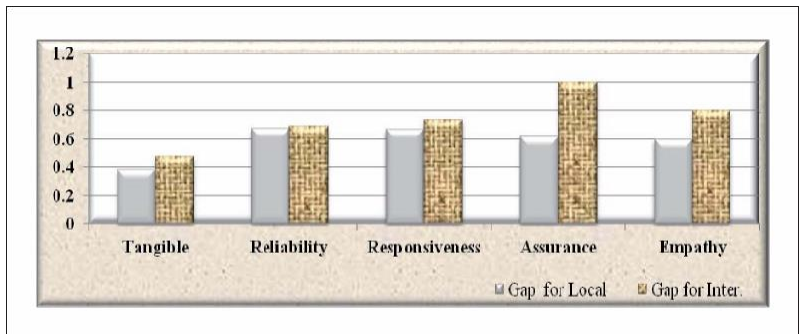
All the Þ ve dimensions for local and international students’ satisfaction achieve a negative average gap score of more than -0.5. The results show that the gap scores for international students exceeded their counterparts for local students on all the SERVQUAL dimensions. Furthermore, the highest gap differences between local and international students comes mainly from the assurance-dimension, followed in descending order by “empathy”, and “reliability”, followed by “responsiveness” dimension with the lowest gap difference (see Figure 6). The high gap difference in the Assurance-dimension will reß ect on the gap scores signiÞ cant differences which will be presented in the following sub-section.
6.3.4Satisfaction gap scores: signiÞ cant differences between students
The gap scores signiÞ cant differences toward university health centre services between local students and international students’ satisfaction are computed as P (Perception) – E (Expectation). Each expectation score was subtracted from its counterpart perception score. A negative difference score indicates that expectation exceed perception; a positive difference score indicated that perception surpassed an expectation. The International and local students’ satisfaction of healthcare services: 49-70 63 displayed results in Table 6 indicate that there are no statistically signiÞ cant differences in the satisfaction level between local and international students toward university health centre services in four dimensions of service quality; “tangible”, “reliability”, “responsiveness”, and “empathy“, in which each of them have got (sig. ≥ 0.05) and shows a parity relation between students’ satisfaction with regard to these dimensions. Only “Assurance” dimension shows a signiÞ cant difference (p-value = 0.002). This signiÞ cant difference in “assurance” dimensions is due to the highest gap differences between both local and international students with regard to this dimension, which was mentioned in the previous relationship between local and international students’ gap score satisfaction (see Figure 6).
| The Dimensions | Local Students | International Students | Sig. | ||||
|---|---|---|---|---|---|---|---|
| t-test | |||||||
| Perception Expectation | Gap Perception Expectation | Gap | |||||
| Mean | Mean | Mean | Mean | ||||
| Tangible | 3.8417 | 4.2284 | -0.387 | 3.6754 | 4.1530 | -0.478 .371 | |
| Reliability | 3.6820 | 4.3568 | -0.675 | 3.5657 | 4.2522 | -0.687 .920 | |
| Responsiveness | 3.7410 | 4.4101 | -0.670 | 3.4963 | 4.2313 | -0.735 .583 | |
| Assurance | 3.7410 | 4.3579 | -0.617 | 3.3116 | 4.3097 | -0.998 .002* | |
| Empathy | 3.6647 | 4.2619 | -0.597 | 3.4254 | 4.2239 | -0.799 .092 | |
| Note: * Significant level at p ≤ .05. | |||||||
6.4Differences of the gap scores among the students
6.4.1Relationship between gap and local students’ demographic variables
Table 7 indicates that there are no significant differences between students’ gap scores for all SERVQUAL dimensions and two demographic variables, which are “students’ ages” and “students’ gender”. Furthermore, the results show that there are significant differences between students’ education level and the students’ gap scores for reliability-dimension. Undergraduate students achieve the highest gap scores. Besides, significant differences between new and senior students are found in four SERVQUAL dimensions, which are “reliability”, “responsiveness”, “assurance” and “empathy”. New students achieve the highest gap scores in all these dimensions.
| The Dimensions | Students’ Ages | Students’ Gender | Education Level | Student’s Status | ||||
|---|---|---|---|---|---|---|---|---|
| F | Sig. | F | Sig. | F | Sig. | F | Sig. | |
| Tangible | .305 | .822 | .200 | .108 | .031 | .861 | 2.81 | . |
| Reliability | 2.54 | .059 | .399 | .419 | 3.90 | .050* | 10.5 | .000* |
| Responsiveness | .231 | .874 | .097 | .821 | .245 | .622 | 7.79 | .001* |
| Assurance | .654 | .582 | .629 | .642 | .205 | .652 | 5.53 | .005* |
| Empathy | .750 | .524 | .189 | .370 | .058 | .810 | 6.44 | .002* |
| Note: * Significant level at p ≤ .05. | ||||||||
6.4.2Relationship between gap scores & international students’ demographic variables
Table 8 indicates that there are no signi ficant differences between students’ gap scores for all SERVQUAL dimensions and two demographic variables, which are “students’ ages” and “students’ gender”. Furthermore, the results show that there are significant differences between students’ nationalities and the students’ gap scores in four SERVQUAL dimensions, which are “tangible“, “reliability”, “assurance” and “empathy”. Asian students achieve the highest gap scores according to “tangible”, “reliability” and “empathy”. Arab students achieve the highest gap scores with respect to “assurance”. Significant differences between students’ education level and students’ gap scores are found in two SERVQUAL dimensions, which are “responsiveness” and “empathy”. Doctorate students achieve the highest gap scores in both dimensions. Finally, significant differences between new and senior students are found in four SERVQUAL dimensions, which are “reliability” and “responsiveness” “assurance” and “empathy”. This result is similar to the previous result for local students. New students achieve the highest gap scores for “reliability”. Senior students achieve the highest gap with respect to “responsiveness” “assurance” and “empathy”.
| The Dimensions | Students’ | Students’ | Students' | Education | Student’s | |||||
|---|---|---|---|---|---|---|---|---|---|---|
| Ages | Gender | Nationality | Level | Status | ||||||
| F | Sig. | F | Sig. | F | Sig. | F | Sig. | F | Sig. | |
| Tangible | 1.17 | .324 | .003 | .154 | 2.13 | .015* 1.94 .148 | 2.40 | .095 | ||
| Reliability | .947 | .420 | 1.75 | .127 | 2.09 | .017* .813 .446 | 4.32 | .015* | ||
| Responsiveness | 1.45 | .231 | 2.58 | .407 | 1.71 | .062 3.02 .052* | 5.43 | .005* | ||
| Assurance | 1.25 | .293 | .296 | .486 | 1.80 | .047* 1.94 .148 | 6.16 | .003* | ||
| Empathy | .939 | .424 | 3.37 | .060 | 1.88 | .036* 4.00 .021* | 4.71 | .011* | ||
| Note: * SigniÞ cant level at p ≤ .05. | ||||||||||
7Discussion
All the fi ve dimensions for both local and international students’ satisfaction achieve a negative average gap score of more than (-0.5); Furthermore, all the satisfaction gap scores for international students exceed their counterparts for local students. In other words, both, local and international students are not satisfi ed with the university health centre. This result is in the same context with the results of studies by Suki et al. (2011) and Nekoei-Moghadam and Amiresmaili (2011).
Based on the findings of this research, it can be concluded that the healthcare centre in the study does not meet the expectations of students and are unable to provide health care services according to their expectations. Thus, the most important factor in the relationship between students’ perceptions and expectations is students’ expectations on healthcare services provided. This conclusion is in line with the studies by Suki et al. (2011) and Bakar et al. (2007), and we support this result. Hence, rearranging the service delivery and deploying better facilities and equipment in order to decrease the gap between students’ perceptions and expectations may be helpful.
From another perspective, local students are dissatisfied mainly with “reliability” dimension. This dimension in the healthcare centre produces the biggest gap scores during students’ evaluation. This means students, overall, are dissatis ed with the level of delivery of the promised performance, dependability and accuracy by healthcare centre settings. One of the possible reasons according to Bakar et al., (2007) is “ It is well known that it is more diffi cult to satisfy highly educated patients and young patients, possibly because those individuals have higher expectations than other groups”.
On the contrary, international students are found to be dissatisfied most with “assurance” dimension. The largest negative gap scores in this dimension obviously shows the difference between students’ expectations and perceptions regarding the staff competence, courtesy, credibility, knowledge and security in the health centre. One of the possible reasons may be due to the cultural challenges, communication difficulties and the ability to adopt with second culture and environment. In this context, Pizam and Ellis, (1999) state that “different languages, levels of literacy, interpretations of constructs and cultural behavior must all be taken into account when creating a foreign customer satisfaction survey”.
The comparison between the local and international students shows that, the highest satisfaction gap scores were associated with the assurance-dimension, followed in descending order by empathy-dimension, and the lowest gap scores were linked to the reliability-dimension, followed by responsiveness-dimension. Moreover, “assurance” is the only dimension which shows signi ficant difference. These findings show an imparity relation between students’ satisfaction in terms of assurance-dimension, which is mostly related to the communication issues between the physician/staff and the patient in the treatment, and the approach that is taken by the physician/staff to explain the disease to the patient. Perhaps, the key problem is the background, culture, and education of the patients. Thus, healthcare providers and managers should look further into improving the areas that have been highlighted.
Finally, access-to-care problems are crucial and need to be addressed by managers and healthcare providers in order to improve the quality of service delivery and patient satisfaction. Moreover, they should realize that perceived service quality is a comparatively long-term attitude. Thus, students are care consumers, and like all consumers, they want good service. Delivering high quality consistently is diffi cult but necessary for any service organization like the healthcare centre.
8Further studies
Using qualitative research along with quantitative methods in the future may enhance the fi ndings of this study. Furthermore, it would be recommended to future researchers that this type of survey be conducted on a larger scale to assist all healthcare centre providers to render better service to their customers. It would be bene fi cial if all healthcare providers would participate and help facilitate and expand the research scope. Finally, this research shows further that expectations and perceptions need to be measured separately.
References
- Anderson, E.A. (1995). Measuring service quality at a university health clinic. International Journal of Health Care Quality Assurance. 8(2): 3 2-37.
- Anderson, E.A., & Zwelling, L.A. (1996). Measuring service quality at the university of Texas M.D. Anderson Cancer Center. International Journal of Health Care Quality Assurance. 9(7): 9-22.
- Andaleeb S. (1998). Determinants of customer satisfaction with hospitals: A managerial model. International Journal of Health Care Quality Assurance. 11 (6): 181-187.
- Babakus, E. & Mangold, W.G. (1992). Patient adapting the servqual scale to hospital services: An empirical investigation. Health Services Research, 26(6): 767-86.
- Bakar C., Akgu¨n H.S. & Al Assaf A.F. (2007). The role of expectations in patients’ hospital assessments: A Turkish university hospital example. International Journal of Health Care Quality Assurance. 21 (5): 503-5 16.
- Bradley, G. (2000). Responding effectively to the mental health needs of international students. Higher Education. 39(4): 417–433.
- Carman, J. M. (2000). Patient perceptions of service quality: Combining the dimensions. Journal of Services Marketing. 14(4): 337-352
- Canel, C. & Anderson E.A. (2001). An analysis of service quality at student health center. International Journal of Health Care Quality Assurance. 14(6): 260-267.
- Cleary P. D., McNeil B. J., (1988). Spring. Patient satisfaction as an indicator of quality care. Inquiry, 25:25-36.
- Daroesman, S., Looi, K., Smyth, C., & Douglas, M. (2004). Quality of administrative and support services for students: Report of the 2003 survey of students based at the Parkville campus, Melbourne: University Planning OfÞ ce. The University of Melbourne
- Dean, A. M. (1999). The applicability of servqual in different health care environments. Health Marketing Quarterly. 16(3), 1-2 1.
- Donabedian, A. (1998). The quality of care. How can it be assessed?. Journal of American Medical Association. 260(12): 1743-1748.
- Fallon, F., & Barbara, D. (2005). Are our international students using the health system effectively? Paper presented at the ISANA Conference. Christchurch, New Zealand.
- Fuentes, M.C. (1999). Measuring hospital service quality: A methodological study. Managing Service Quality. 9 (4), 230-240.
- Gronroos, C. (1984). A service quality model and its marketing implications. European Journal of Marketing. 18(4): 36-44.
- Jabnoun, N. & Chaker, M. (2003). Comparing the quality of private and public hospitals. Managing Service Quality. 13 (4), 290-300.
- Johnston, R. (1995). The determinants of service quality: SatisÞ ers and dissatisÞ ers. International Journal of Service Industry Management. 6(5): 53-7 1.
- Kearney, L. K., Draper, M., & Baron, A. (2005). Counseling utilization by ethnic minority college students. Cultural Diversity and Ethnic Minority Psychology. 11(3): 272–285.
- Kilinc, A., & Granello, P. F. (2003). Overall life satisfaction and help-seeking attitudes of Turkish college students in the United States: Implications for college counselors. Journal of College Counseling. 6(1): 56–68.
- Lam, S.S.K. (1997). SERVQUAL: A tool for measuring patients’ opinions of hospital service quality in Hong Kong. Total Quality Management. 8(4): 145-152.
- Lewis, B.R. (1989). Quality in the service sector – A Review. International Journal of Bank Marketing. 7(5).
- Lewis, B.R. & Mitchell, V.W. (1990). DeÞ ning and measuring the quality of customer service. Marketing Intelligence & Planning, 8(6): 11-17.
- Lim, P.C., Tang, N.K.H. (2000). A study of patients’ expectations and satisfaction in Singapore hospitals. International Journal of Health Care Quality Assurance. 13(7): 290-9.
- Mostafa, M.M. (2005). An empirical study of patients’ expectations and satisfactions in Egyptian Hospital. International Journal of Health Care Quality Assurance. 18(7): 516-532.
- Murphy, J. A. (1993). Service Quality in Practice. Dublin, Ireland: Gill and Macmillan.
- Nekoei-Moghadam, M. & Amiresmaili, M. (2011). Hospital services quality assessment-Hospitals of Kerman University of Medical Sciences, as a tangible example of a developing country. International Journal of Health Care Quality Assurance. 24(1).
- Ovretveit, J. (2000). The economics of quality. International Journal of Health Care Quality Assurance. 13(5): 200-107
- Owusu-Frimpong, N., Nwankw, S., & Dason, B. (2010). Measuring service quality and patient satisfaction with access to public and private healthcare delivery. International Journal of Public Sector Management. 23 (3).
- Parasuraman, A., Zeithaml, V.A. & Berry, L.L. (1985). A conceptual model of service quality and implications for future research. Journal of Marketing. 49, Fall: 42 50.
- Parasuraman, A., Zeithaml, V.A. & Berry, L.L. (1988). SERVQUAL: A Multiple-item Scale for Measuring Consumer Perceptions of Service Quality. Journal of Retailing, 64(1): 12-40.
- Parasuraman, A., Berry, L.L., Zeithaml, V.A. (1991). ReÞ nement and reassessment of the SERVQUAL scale. Journal of Retailing. 67(4): 420-50.
- Pizam, A. & Ellis, T. (1999). Customer satisfaction and its measurement in hospitality enterprises. Int ernational Journal of Contemporary Hospitality Management. 11(7): 326-339.
- Reidenbach, R.E., Sandifer-Smallwood, B. (1990). Exploring perceptions of hospital operations by a modiÞ ed SERVQUAL approach. Journal of Health Care Marketing. 10(4): 47-55.
- Rose, R.C., Uli, J. Abdul, M. Ng, K. L. (2004). Hospital service quality: A managerial challenge. International Journal of Health Care Quality Assurance. 17(3): 146-159.
- Russell J., Thomson, G. and Rosenthal, D. (2007). International student use of university health and counseling services. The International Journal of Higher Education and Educational Planning. 56(1): 59-75.
- Sekaran, U. (1992). Research Methods for Business: A Skill Building Approach. (2nd ed.). New York: John Wiley and Sons, Inc.
- Sewell, N. (1997). Continuous quality improvement in acute health care: Creating holistic and integrated approach. International Journal of Health Care Quality Assurance. 10(1): 20-26.
- Sohail S.M. (2003). Service quality in hospitals: more favorable than you might think. Managing Service Quality. 13(3): 197-206.
- Suki, N. M., Lian, J. C., & Suki, N. M., (2011). Do patients’ perceptions exceed their expectations in private healthcare settings. International Journal of Health Care Quality Assurance. 24 (1).
- Taylor, S.A. & Cronin, J.J. (1994). Modeling patient satisfaction and service quality. Journal of Health Care Marketing. 14(1): 34-44.
- Tomes, A.E. & Ng, S.P.C. (1995). Service quality in hospital care: The development of an inpatient questionnaire. International Journal of Health Care Quality Assurance. 8(3): 25-33.
- Tucker, J.L., & Adams, S.R. (2001). Incorporating patients’ assessments of satisfaction and quality: An integrative model of patients’ evaluations of their care. Managing Service Quality. 11(4): 272-287.
- Vandamme, R., & Leunis, J. (1993). Development of a multiple-item scale for measuring hospital service quality. International Journal of Service Industry Management. 4(3), 30-49.
- Wong, J.C.H. (2002). Service quality measurement in a medical imaging department. International Journal of Health Care Quality Assurance. 15(5): 206-212.
- Zeithaml, V.A., Bitner, M. J., & Gremler, D.D. (2006). Services Marketing: Integrating Customer Focus across the Firm, 4th edition. McGraw-Hill, New York, NY.