Determining Critical Elements in Strengthening the Organisations: A Study on the Public Sector
- School of Technology Management and Logistics, College of Business, Universiti Utara Malaysia, Sintok, Kedah
Journal of Business Management and Accounting 5(1) (2015) · https://doi.org/10.32890/jbma2015.5.0.8867
Abstract
This paper presents the results of a case study conducted on three public sector organisations. The main objectives of this study were to identify critical elements which affect the organisations’ performance and to analyse competitive elements in organisations. The McKinsey 7S framework and the Kano Model were used to identify critical elements that need to be focused on in eachorganisation. The findings demonstrated that there are three elements that need to be finely thought-out in the formation and maintenance of the three public sector organisations. These elements are staff, structure, and skill. The results of the study can assist these organisations to clearly identify their organisational strengths and weaknesses. Accordingly, it helps in finding the middle ground to get all the elements into harmony that motivate the stimulation of highly effective functioning employees toward achieving better organisational performance.
Keywords: Organisational performance, corporate culture, competitiveness, strategy
2.0Toward Better Organisational Performance
Organisational performance involves recurring activities to establish organisational goals, monitor progress toward these goals, and make adjustments to achieve those goals more effectively and efficiently. According to Lichtenthaler (2007) and Shieh and Wang (2010), corporate culture or the values of a company that would govern the activities and behaviour of the staff will influence the performance of the organisation. Those recurring activities are much of what leaders and managers inherently do in their organisations. To improve the performance of the organisation, change is unavoidable. For organisations to develop, they often must undergo significant change at various points in their development. Generally, the axiom of the terms “organisational change” is about a significant change in the organisation, such as reorganisation or adding a major new product or service which is different with smaller changes, such as adopting a new computer procedure or using new equipment. Specialists accentuate that successful organisational change requires a change in culture. An example of organisational change which might change the corporate culture is transformational or radical change. The changing in terms of transformational change might involve the changing in the organisation’s structure from the traditional top-down, hierarchical structure to a large amount of self-directing teams. Change can be intended to remedy current situations or more general and vague like developmental projects (McNamara, 2015). Remedial projects often address a current, major problem, therefore it would seem more focused, as compared to developmental projects. For example, it is performed to improve the poor performance of a product or the entire organisation, and reduce burnout in the workplace. It is also intended to help the organisation to become much more proactive and less reactive, or address large budget deficits. It is often easier to determine the success of these projects because the problem would be solved or otherwise. On the other hand developmental projects target to make a successful situation even more successful, for example, expand the amount of customers served, or duplicate successful products or services, depending on how specific the goals are and how important it is for members of the organisation to achieve those goals. However, successful organisational change can be quite difficult to accomplish. It can be like trying to change routines. Providentially, there is an increasing body of research, practice, and tools from which all can learn about how to make the change in an organisation successful.
3.0Conceptual Model
The McKinsey 7S framework highlights the importance of organisational interconnection and their role in effecting change. In the McKinsey model, the organisation is divided into seven areas of regions “soft” and “hard” elements. Strategy, structure, and system hardware elements are more easily identifiable and manageable, compared to the soft elements (Alshaher, 2013). The relationship between each element “S” can be used to identify the strengths and weaknesses of an organisation. However, the strength or weakness of an S element cannot be viewed in isolation. It must be seen in terms of the level of support one element has for another element. Table 1 describes the elements in the McKinsey model.
| Dimension | Definition |
|---|---|
| Strategy | Actions a company plans in response to changes in its external environment |
| Structure | Basis of specialization and co-ordination influenced primarily by strategy, size and diversity of organization |
| Systems | Formal and informal procedures that support the strategy and structure |
| Style / Culture | Consisting of two component as below: • Organizational culture: the dominant values, beliefs, and norms which develop over time and become relatively enduring features of organizational life. • Management style: more a matter of what managers do than what they say: how do company mangers spend their time: what are they focusing on |
| Staff | The people/human resource management processesused to develop managers, socialization processes, and ways of introducing young recruits to the company. |
| Skills | The distinctive competences- what the company does best |
| Shared Values | Guiding concepts, fundamental ideas around which a business is built- must be simple, usually stated at abstract level, have great meaning inside the organization even though outsiders may not see or understand them. |
McKinsey 7S model is illustrated in the following diagram (Figure 1).
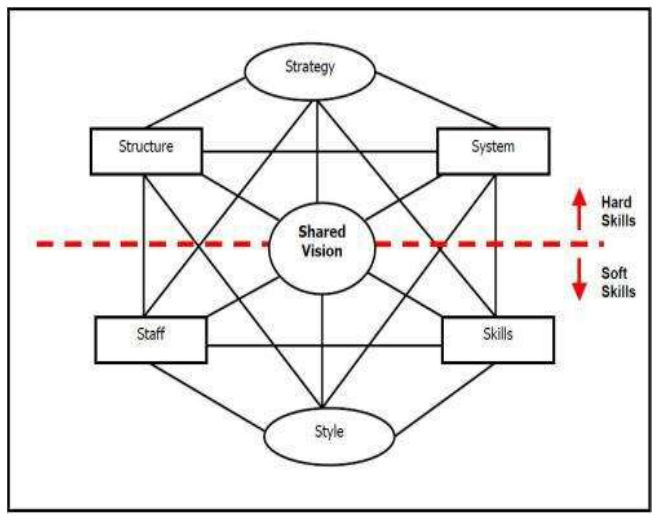
Based on this 7S model, for the organisation to succeed and fit with the external environment, the 7S elements must be in alignment with each other. Therefore the implementing strategy is to first ensure that all these 7Ss elements are working in a harmonious network. The organisations must realise that their staff’s expectations and needs vary over time, for example, for the staffs or internal customers of the organisation to be efficient in accomplishing the activities in the organisation, they need a clear structure which specifies their role in the organisation. A good structure reduces internal uncertainty about their role in the organisation, and thus reduce random human behaviour within the organisation. The main facts to take into consideration are what excites customers in the past are now expected, and what is expected today will not meet minimum customer expectations in the future. For an organisation to analyse the internal consumer needs, one powerful technique to address these enquiries is the Kano Model which has been developed by Noriaki Kano and his colleagues in 1984. According to Keder and Alhazza (2014), the advantages of classifying customer requirements using Kano method are various and clear, as it is able to provide priorities of the variables and better understanding on the criteria which have the greatest influence on customer satisfaction. These are accordance with the work by Zhang and Von Dran (2002), which specified that “the Kano model is suitable for discovering the categories of customer expected quality as well as it can help to identify and understand the life cycle of quality element”. Besides, Chen and Su (2006) approved that the Kano model can be used to extract tacit knowledge of customers, therefore it can help researchers to understand knowledge regarding customers. The Kano Model was initially introduced to assess the level of customer satisfaction with a product. This model was later adopted by many researchers to measure customer satisfaction on service quality in the services sector. Through the user satisfaction model, it is divided into three sections: the quality expected, normal quality, and the quality of the unexpected. The Kano analysis helps to identify unspoken needs before prioritisation. It is intended to help prioritise customer needs and should be linked to a company’s multi-generational project plan. Based on Kano’s theory, “customer satisfaction is proportional to the extent to which the product or service is fully functional”.
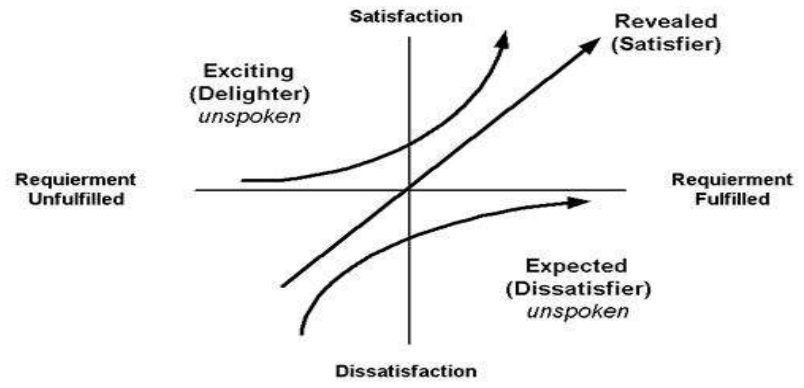
The next requirement concerns the standard characteristics that increase or decrease satisfaction by their degree (cost/price, ease of use, and speed). With regard to the performance needs requirements, customer satisfaction is proportional to a higher level fulfilment—level of performance, higher customer satisfaction, and vice versa, for example, having good Internet access or efficient technological support at the working place. 3) Excitement Needs
At this level, the businesses should deliver the unexpected features or characteristics that impress customers and earn the organisation “extra credit”. The fulfilment of these requirements leads to more than proportional satisfaction; however, there is no feeling of dissatisfaction if they are not met. These needs also are typically “unspoken”. Upon reaching this level, the organisation has a great chance to excel to be a world class organisation.
4.0Methodology
To identify the critical elements influencing public sector organisational performance, a survey was conducted on three public sector organisations under the Ministry of Natural Resources and Environment in Malaysia. The aim was to make a comparison between these organisations in terms of the factors that influence their organisational performance. These organisations were selected as they have differences in structure and roles, although they are assigned under the same ministry. These organisations are briefly described in Table 2. Determining Critical Elements in Strengthening the Organisations: A Study on the Public Sector: 155-169 161
| Organisation | P | Q | R |
|---|---|---|---|
| Year of 1929 | 1932 | 2004 | |
| establishment | |||
| Number of 850 | 1450 | 355 | |
| Employees | |||
| Description The activities of this | This organisation’s | This organisation is | |
| organisation focus | activities focus on | responsible for natural | |
| on research and | water management | resources management | |
| development on the | such as river | such as forest management; | |
| sustainable management | management, flood | irrigation and drainage | |
| of resources and | management, coastal | management; wildlife | |
| ecosystem services | management, storm | management and mineral | |
| of natural, urban, | water management, | management; conservation | |
| and recreational | dams and also water | and management of | |
| locations; development | resources management | environment and shelters; | |
| of technologies and | and hydrology. | management of land | |
| products based on | survey and mapping | ||
| biodiversity resources | administration. | ||
| for forest and herbal | |||
| plantations; provide and | |||
| develop key scientific | |||
| knowledge to safeguard | |||
| biodiversity and system | |||
| services, and etc. |
5.0Discussion and Findings
The number of responses received from organisations P, Q, and R was 194, 180, and 178 respectively. Table 3 further shows the breakdown of the data. It is obvious that 55% of the respondents are female, while the remaining are male. The majority of them are in the management and professional group, and aged between 31 to 40 years old. About 80% of the respondents have more than six years tenure of service in the organisations, which reflects that most of them have ample time to see changes in the organisations.
| Organisation | Organisation | |||
|---|---|---|---|---|
| Demography | Category | Organisation P | Q | R |
| Gender | Male Female | 87 107 | 94 86 | 67 111 |
| Age | Less than 30 years old 31-40 years old 41-50 years old More than 50 years old Management & | 39 85 45 25 | 13 125 10 32 | 33 103 23 19 |
| Type of position | Professional Executive (17-40) Executive (1-16) | 148 45 1 | 106 70 4 | 96 79 3 |
| Period of | Less than one year | 14 | 3 | 9 |
| service | 1-5 years 6-10 years 11-15 years More than 15 years | 33 51 39 57 | 24 85 23 45 | 30 55 50 34 |
The descriptive analysis was used to identify the critical elements from the 7s McKinsey framework for each organisation. Table 4 shows the mean score and percentage of the seven factors for each organisation. Overall, the table shows that the factor that has highest mean score is Strategy with a percentage score of 74.42%, followed by System, Style, and Shared Values with the percentages of 72.25%, 71.83%, and 71.33% respectively. However, three factors from the 7S elements had a low mean score which was below 2.8, namely the Staff, Structure, and Skill elements (68.92%, 68.83%, and 68.25%), respectively. In general, the average scores for the seven elements were around 68.25% to 74.42%. Therefore, the percentage illustrates that there is still a relatively large gap to make improvements by the organisations.
| Mean score | Percentage (%) | Overall | ||||||
|---|---|---|---|---|---|---|---|---|
| 7S Elements | Mean | % | ||||||
| P | Q | R | P | Q | R | Score | ||
| Strategy | 3.26 | 2.75 | 2.92 | 81.50 | 68.75 | 73.00 | 2.98 | 74.42 |
| Structure | 2.94 | 2.60 | 2.72 | 73.50 | 65.00 | 68.00 | 2.75 | 68.83 |
| System | 3.10 | 2.65 | 2.92 | 77.50 | 66.25 | 73.00 | 2.89 | 72.25 |
| Shared values | 3.07 | 2.65 | 2.84 | 76.75 | 66.25 | 71.00 | 2.85 | 71.33 |
| Style | 3.09 | 2.70 | 2.83 | 77.25 | 67.50 | 70.75 | 2.87 | 71.83 |
| Staff | 3.01 | 2.50 | 2.76 | 75.25 | 62.50 | 69.00 | 2.76 | 68.92 |
| Skills | 2.78 | 2.60 | 2.81 | 69.50 | 65.00 | 70.25 | 2.73 | 68.25 |
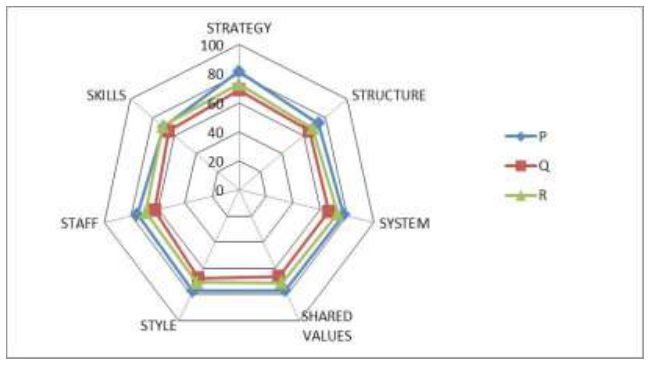
In most cases, the effective organisation strives to achieve a balance among the seven elements. A change in one element will subsequently affect the performance in other elements. Based on Table 4, the element that has the highest score in Organisation P, Q, and R is the element of Strategy. However, the element that has the lowest score in the three organisations are varied. The element with the lowest score in Organisation P is the element of Skill, while in Organisation Q and Organisation R, the elements that have the lowest score are Staff and Structure, respectively. The 7S framework highlights important organisational interconnections which will help in bringing about the needed strategic shift. Figure 3 shows the level of each element of 7S for Organisations P, Q, and R which illustrates the organisational environment of these organisations.
5.1Kano Model
The mean score for each of the seven factors were then categorised based on the Kano Model. According to Seder and Alhazza (2014), all customers are different and have different priorities—what one describes as an excitement requirement may be described as a performance requirement by others. In view of this, for the purpose of this study the range of percentage to categorise the requirements was secured to a certain level as shown in Table 5. This range was adapted from several research conducted in the private sector.
| Range of Percentage | Category of Requirement |
|---|---|
| 95 and above | Satisfying excitement needs |
| 85 to 94.99 | Satisfying performance needs |
| 70 to 84.99 | Satisfying basic needs |
| Below 70 | Not satisfying (Below Basic) |
Figure 4 displays the result as a percentage of the satisfaction of internal customers who experienced the elements at the organisations based on the classification of Kano Model.

The level of customer satisfaction on four of the seven elements can be categorised as satisfying basic needs as they are in the range of 70% to 84.99%. The rating shows that customers are not dissatisfied with the quality of the four elements. However, three of the seven factors have been rated below 70%, which indicated that the staff of the organisation are not satisfied with the condition of these elements, namely staff, structure, and skills. Therefore, it can be concluded that these elements require more effort spent in order to improve the performance of the organisations.
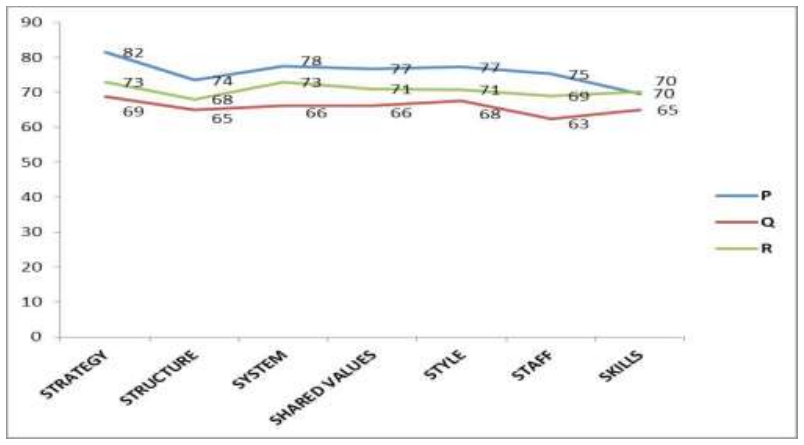
The percentages of rate for the seven elements for each organisation are demonstrated in
the scores are more than 70%, except for the skill element, which is 69.5%. This results indicated that the staff of Organisation P are quite satisfied with the organisational environment of their organisation. On the other hand, all scores for the seven elements of organisation Q are less than 70%, which is below the basic requirement of the Kano Model, while organisation R has two elements that fall under the below basic category, namely structure (68%), and staff (69%). These results indicated that the organisations require proper alignment of different activities and processes within the organisation, such as structure, staffing, resource allocation, skills, style, rewards and incentives, shared values and abilities, policies, and procedures in order to be more successful. Moreover, the results of the study may be reflected by the nature of the organisations itself. Organisation P is an institution focused more on research and development, established since 1929 with a very specific area of function. Organisation Q also has been established for a long time (1932), however, it serves the communities in the country. It has a department in each state of the country, thus the structure is more complicated as compared with organisation P and Organisation R. Conversely, organisation R is quite new, established in 2004, and organises and monitors all the departments and agencies under the Ministry of Natural Resources and Environment. In a nutshell, the findings put forth a significant implication that capacity building remains as a great challenge in transforming the public sector toward achieving better organisational performance. Indeed, revitalising the government servants with the focus on competency and skills has been the prime concern, which was addressed in the first strategic thrust of government sector transformation plan (JPA, 2016). Practically, several strategies shall be embedded in the action plan of the studied organisations to address the issue, such as making a progressive career path available to the employees, empowerment, incentives for innovation, collaborative working, and excellent service delivery. The employees also should be equipped with the relevant skills to face the increasingly challenging work environment, for instance skills in negotiation, information technology, contract management, risk analysis, and strategic planning (PWC, 2007). This is because the reform of public services to deliver customer-centric services can only be achieved with the commitment of a highly-motivated, flexible, diverse, and skilled workforce, capable of providing high-quality and personalised public services (PWC, 2007).
6.0Conclusion
Based on the results of analysis via the McKinsey 7S framework, it was found that among the 7S elements, three elements need to be considered in the formation and maintenance of the three public sector organisations, namely staff, structure, and skill. Besides that, the Kano Model analysis indicated that the staff of the organisations are not happy with the condition of several elements, especially in terms of staffing which refers to selection, placement, training, and development of appropriately qualified employees; the structure of the organisation or in other words the formal relationships among various positions and activities in the organisation; and skill, one of the crucial attributes or capability of an organisation, which is also referred as to the distinctive competence in the organisation. The findings from McKinsey 7S framework and Kano Model can assist these organisations to clearly identify their organisational strengths and weaknesses. This study provides a number of information to organisations P, Q, and R and the Ministry of Natural Resources and Environment that will help in their strategy to improve these organisations. It gives a clear picture to the organisations in getting all the 7Ss into harmony to stimulate highly effective functioning towards achieving better organisational performance.
References
- Alshaher A. A. F., (2013). The McKinsey’s model framework for e-learning system readiness assessment. International Journal of Advances in Engineering & Technology, 6(5), 1948-1966.
- Carter McNamara, (2006). Organisational Performance Management -- Evaluating and improving organisations. http://managementhelp.org/organisationalperformance/
- Carter McNamara, (2006). Authenticity consulting, LLC. Organisational change and development (managing change and change management). http://managementhelp. org/organisationalchange/index.htm
- Chen Y. H., and Su, C. T., (2006). A Kano-CKM model for customer knowledge discovery. Total Quality Management, 17(5), 589-608.
- Hanafizadeh, P., and Ravasan, A. Z., (2011). A McKinsey 7S model-based framework for ERP readiness assessment. International Journal of Enterprise Information Systems, 7(4), 23-63. JPA. Transforming Public Service In Malaysia: Guidelines for developing a transformation plan. http://docs.jpa.gov.my/docs/transformasi/Manual/Manual_ English_081014.pdf
- Kano N., Seraku N., Takahashi, F., and Tsuji, S., (1984 ). Attractive quality and must-be quality. Journal of Japanese Society for Quality Control, 14, 39–48.
- Lichtenthaler, E., (2007). Managing technology intelligence processes in situations of radical technological change. Technological Forecasting and Social Change, 74, 1109-1136
- Peters, T., and Waterman, R. H., (1982). In search of excellence. New York, NY: Harper and Rowe.
- PWC., (2007). The road ahead for public service delivery: Delivering on the customer promise.https://www.pwc.com/gx/en/psrc/pdf/the _road_ahead_for _public_ service_delivery.pdf
- Seder A. M. F., and Alhazza, M. H. F., (2014). Review on the theory of attractive quality Kano Model. Journal of Advanced Engineering Research. 4(2), 88-102.
- Shen, S., Tan, K. C., and Xie, M., (2000). An integrated approach to innovative product development using Kano’s model and QFD. European Journal of Innovation Management, 3(2), 91-99.
- Shieh, C., and Wang, I., (2010). A study of the relationships between corporate core competence, management innovation and corporate culture. International Journal of Organisational Innovation (Online), 2(3), 395-411.
- Stroud J. D., (2015). The Kano analysis: Customer needs are ever changing. Six Sigma 2000-2015. http://www.isixsigma.com/tools-templates/kano-analysis/kano-analysis-customer-needs-are-ever-changing/
- Tan, K. C., and Shen., (2000). Integrating Kano’s model in the planning matrix of quality function deployment. Total Quality Management, 11(8) 1141-1151.
- Zhang P., and Dran, G. M. V., (2002). User expectations and rankings of quality factors in different web site domains. International Journal of Electronic Commerce, 6(2), 9-33.