Influence of Capital Structure on Profitability: Empirical Evidence from Listed Nigerian Non-Financial Firms
- Tunku Puteri Intan Safinaz School of Accountancy, College of Business, Universiti Utara Malaysia, Sintok, Kedah
Journal of Business Management and Accounting 8(2) (2018) · https://doi.org/10.32890/jbma2018.8.2.8802
Abstract
Sound and effective capital structure is important for sustainable growth and development of any firm. This research work investigates the impact of capital structure on the financial performance of firms in Nigeria. A total of one hundred and six (106) non-financial firms listed on the Nigerian Stock Exchange between 2012 to 2016 were used as sample. Panel data for the selected firms were generated and analyzed using fixed effect model as a method of estimation. The dependent variable for the study is profitability which was measured as Return on Assets (ROA). The independent variables on the other hand are total debts to total assets (TD), total long term debts to total assets (LTD) and short term debts to total assets (STD) used independently. Sales Growth, Firm Growth and Firm Age are used as control variables. Results indicates a negative significant relationship between Total Debt to Asset, and short term debt with return on assets (ROA), on the other hand, an insignificant relationship between long term debt and return on assets.
Keywords: Capital structure, firm performance, long term debt, profitability, return on assets
1.0Introduction
In today’s dynamic and competitive business environment, capital structure decision plays a basic and vital function in the operations and day to day activities of a firm. Capital structure decision influence nearly all the activities in the firm. The issue of capital structure (CS) started to generate interest in accounting and finance ever since the publication of the seminal paper of Modigliani and Miller (1958). Modigliani and Miller (1958) formulated a proposition that in a perfect capital market free of taxes, transaction cost and other frictions, capital structure is irrelevant in ascertaining firm value. This proposition popularly known as MM model led to numbers of research on capital structure with researchers examining the robustness of the model.
Following the 1958 and 1963 Modigliani and Miller publications, series of theories have been propounded by scholars to elaborate on firms’ optimal capital structure. The most popular among the theories includes the agency theory, the trade-off theory and the
E-mail: aminu.abdulrahim68@gmail.com pecking order theory. Hence, optimal capital structure started to generate a great interest for generality of scholars and researchers in the areas of accounting and finance. Optimal capital structure (OCS) is extremely important to firm capability to succeed in both short and long-term growth realities. It provides that firms needs to maintain a sufficient degree of capital in both favourable and unfavourable conditions.
The intrinsic hazard in the global and local markets have contributed to firms’ managements tailoring their capital structure decisions to accomplish their ultimate goals. According to Abu-Rub (2012) capital structure decision changes according to the proportion of financial risk related to each firms financing choices together with the connection between return and risk. Generally, firms seek to adopt a financing structure that will guarantee less cost to achieve the objective of maximizing shareholders’ wealth. However, equity financing and debt financing (short-term and long-term debts) are the major source of financing firms’ operation and they have distinct incentive features, and in turn distinct influence, on firms’ profitability. The role of debt financing (short-term, long-term and total debt financing) on firms’ profitability is one of the primary objectives of contemporary researches.
2.0Statement of Problem
According to Nwude, Idam, Bamidele and Sergius (2016), Nigeria’s capital market structure is characterized by immature debt and equity markets as almost all firms’ debt financing are significantly short-term debts. Consequently, most of the firms in the country depend more on specialized financial institutions or other commercial banks that provide most of the external funds. Therefore, the need for an investigation of the influence of debt financing (total debt, short term, and long term debt) on Nigeria firms’ profitability becomes important since they have distinct returns and risk features. This comparison is necessary to be included in the measures of capital structure owing to distinct results they normally disclosed when there is situations or instances of inappropriate of funding decision by the firm.
This study focuses on investigating the influence of total debt, long term and short term debt financing on the profitability of non-financial firms listed on the Nigerian stock exchange. More often than not, reported research works have taken a single measurement of debt structure in relation to profitability of Nigerian firms. However, there are a handful of studies that have found that total debt, long term and short term debt ratios are useful measurement of debt ratio in an emerging market like Nigeria owing to fund mismatch caused by scarcity of long term debts (Nwude, et al. 2016). A circumstance whereby long term investment operations are funded by short term debt financing, such operations are prone to default as repayment of principal and payment of interest may be required when the returns (cash inflow) from the investment may not be easily available. Empirical investigation conducted by Nwude et al. (2016) disclosed that Nigerian firms are largely short-term debt financing dependent and according to Lucey and Zhang (2011) the main causes of high ratio of short debts in firms’ capital structure is that there are feeble legal and financial institutions in emerging economies. This compels creditors to use short term debt financing as a means of controling and monitoring of borrowers’ activities.
In view of the above findings, what is the influence of debt finance on the return on assets of Nigerian listed firms since it was argued by Nwude et al. (2016) that the Nigerian business environment is characterized by weak financial and legal institutions? A remarkable difference between the capital structures of Nigerian firms and those in developed countries (example, United State, Switzerland etc.) is that Nigerian firms presumably prefer short term debt financing with a substantially lower ratio of long term debt. The implication is that Nigerian firms rely heavily on short term debt financing rather than long term debt finance and this, to an extent, might limit the explanatory power of the capital structure theories in Nigeria. From the foregoing, it is thus relevant to understand how debt financing influence firms’ profitability in Nigeria in recent times. This research work aiming at providing the view to firm management in Nigeria about the connectivity that exist between debt structure and profitability.
3.0Literature Review
Modigliani and Miller introduced the Relevancy/Irrelevance model of capital structure in 1958. They formulated a proposition that a firm could not adjust the value of its outstanding securities by adjusting the ratio of its capital structure elements (Debt and Equity). In 1963, a new proposition was presented by Modigliani and Miller (1963) introducing taxes into their earlier model. This implied that their earlier model of 1958 was planned under an excellent and flawless capital market conditions, thus, the worth of any firm is not dependent on its financing decision. Nevertheless, those assumptions could not hold in the real world, but by the time those assumptions were relaxed, capital structure decision becomes a weighty factor that determined the profitability and value of a firm (Sheikh and Wang 2010). That is why Modigliani and Miller Relevancy/Irrelevance model capital structure proposition face challenges for being strictly theoretical (Danso & Adomako, 2014). These challenges led to the development of several capital structure theories by different scholars and researchers.
The pecking order theory considered three financing sources: retained earnings, debt and equity as the available firm financing sources in order of their priority. The theory was firstly propounded by Donaldson in 1961 in an effort to describe the financing behaviour of firms’ management. It was however articulated clearly by Myers and Majluf (1984).
The trade-off theory on the other hand is assumed to be prominent and the oldest theory relating to firms’ financing choice, the original version came into being after the Modigliani-Miller proposition in 1963. Kraus and Litzenberger (1973) established the classical form of the theory that optimal debt level follows a trade-off between tax advantages of debt and insolvency costs. Kraus and Litzenberger (1973) stated that in a complete and flawless capital market, the firms’ market worth is not dependent on its capital structure.
Agency theory emerged to explain the relationships between the owners and the agents, and those between debt-holders and equity-holders. The roots of the agency debate can be traced from the publication of Berle and Means (1932) in which it was established that the separation of principal (ownership) and control gives the agents (managers) the chance to pursue their interests against owners’ interests. It was developed later by Jensen and Meckling in their 1976 publication. Agency Cost theory maintains that the optimal capital structure is determined by agency cost, which results from conflict of interest between firms’ stakeholders.
The work of Modigliani and Miller and development of several theories of CS thereafter has attracted the focus of many researcher trying to investigate the empirical reality of optimum capital structure (OCS). OCS can be described as the ratio of total debt to the total assets at book value which influences both riskiness and profitability of the firm (Bos & Fetherson 1993). The divergence of ideas between scholars can be viewed from the influence of debt financing on profitability. While some scholars found positive relationship of debt financing on profitability, some also found negative and others provided mixed results.
Abor (2005) uses ROE (return on equity) to measure the performance of listed firms in Ghana in relation to debt ratio, the result indicates a positive relationship between ROE and short-term debt ratio. Baum, Schafer and Talayera (2006) also found a positive influence, arguing that debt financing positively influences firms’ achievements. Margrates and Psillaki (2010) and many other researchers also found positive influence.
On the contrary, Mohammad and Jaafer (2012) uses ROE to measure the performance of 39 firms listed on the Amman stock exchange in relation to debt ratio. The result indicates a negative association between total, long-term, and short-term debt with ROE. Kebewar (2013) disclosed that debt have negative influence on profitability on French firms during 1999 to 2006. Onaolapo, and Kajola. (2010); Nwude, et al. (2016) Hassan, Faisal, and Muhammad (2016), and many other researchers also argue that the relationship between debt financing and profitability is a positive one.
Besides the positive and the negative influence of debt financing on firm profitability, some empirical studies also produced mixed results. The research work of Cheng, Liu and Chien (2010) which investigated 650 firms in China produced a positive relationship of the debt ratio between 53.97% - 70.48%. However, when the debt ratio exceeded 70.48%, the relationship became negative. Dwilaksono (2010) study the effect of STD (short- term debt) and LTD (long-term debt) to profitability of Mining industrial firms listed on the Indonesian stock exchange between 2003-2007 and found a positive relationship between STD and profitability and a negative relationship for LTD and profitability. Li Meng, Wang and Zhou (2008) and Agarawal and Zhao (2007) also found mixed results in their research works. Influence of Capital Structure on Profitability: Empirical Evidence from Listed Nigerian Non-Financial Firms 1-16 5
4.0Data Description and Methodology
The sample size of this study is the entire 115 non-financial firms listed on the NSE (Nigerian Stock Exchange). However, a total of nine (9) firms that do not have complete records or not in existence between 1st January 2012 and 31st December 2016 are excluded. After excluding those firms, the data consist of 106 firms that were used for the analysis. Information regarding the individual firms was obtained through their annual reports audited by statutory auditors and published by the Nigerian Security and Exchange Commission.
| Variables Code Measurement References |
| Profitability Returns on Assets ROA Net Income / Total Nwude et al. (2016) |
| Assets Hassan et al. (2016) |
| Capital Debt ratio Total debt TDR Total debt / Total Nwude et al. (2016) |
| structure Assets Hassan et al. (2016) |
| Long-term LTDR Total long-term Nwude et al. (2016) |
| debt debt/ Total Assets Hassan et al. (2016) |
| Short-term STDR Total short-term Nwude et al. (2016) |
| debt debt/ Total Assets Hassan et al. (2016) |
| Control Firm Age FA Number of years Agyei & |
| variables since incorporation Owusu |
| (2014). |
| Firm FG Percentage change Nwude et |
| growth in total assets al. (2016) |
| (At – At-1 / At-1)% |
| SG Percentage change |
| Sales in total sales Nwude et al. (2016) |
| growth (At – At-1 / At-1)% |
| Nwude et al. (2016) |
| Hassan et al. (2016) |
| In presenting the results, the main focus of the dependent variable will be on Profitability |
| (for this study profitability is return on assets, ROA). Return on assets (ROA) is the |
| financial ratio that shows the percentages of profit that a company earns in relation to |
| its overall resources (total assets). ROA gives an idea on how efficient management is |
| at using its assets to generate earnings. The independent variables on the other hand are |
| (TD, LTD & STD) used independently. Some firm characteristics (FA, FG & SG) were |
| usedHas control variables. Firm Age indicate the opportunity and strength of the firm |
| 1. The profitability of a firm is negatively influenced by debt ratios in term of total debt, long- |
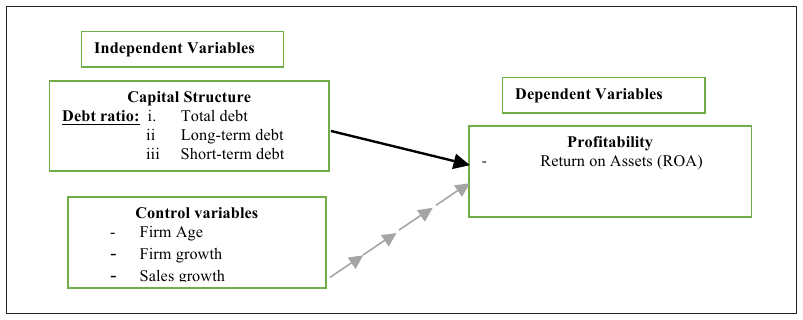
in dealing with the business over a long period of time. Firm growth has predictive power termfordebt future firms’ returns, and short-term debt. while sales growth is normally associated with firms’ profitability and sensitive to inflation and local currency exchange rate. However, the measurement of the independent variables (capital structure) and control variables are indicated in Table 1 as supported by different scholars cited in the references column. Specification of Model: This study adopted a model used by Nwude et al. (2016) with little Hypotheses modification by using growth measurement in place of firm size. Firm’s profitability (ROA)
H1. The profitability measurement was of a firm isseparately regressed negatively influenced with by proxies each of the debt ratios in term of CS, of variables control total debt,and long-term debt and short-term debt. other bonding factors that may influence the performance of the firms not included in the Specification of Model: This study adopted a model used by Nwude et al. (2016) with equation model. These analytical experiment will furnish the researcher with justifiable and little modification by using growth measurement in place of firm size. Firm’s profitability (ROA) measurement straightforward was regressed separately with each of the proxies of CS, control results. variables and other bonding factors that may influence the performance of the firms not included Y = !in 0 +the !1Xequation it + !2Zit +model. µ….. (1)These Where:analytical experiment Y = dependent Variable;will !0 =furnish the Constant researcher (intercept) of Y; with justifiable and straightforward results. Xit = Independent Variables; Zit = Control Variables; !1 and !2 = Coefficient of IV (independent Y = β0 + β1Xit + β2Zit + μ….. (1) Where: Y = dependent Variable; β0 = Constant (intercept) variable) and CV (control variables); µ = Stochastic (Random) variables. of Y; Xit = Independent Variables; Zit = Control Variables; β1 and β2 = Coefficient of IV (independent variable) The empirical and equation CV (control models, estimatedvariables); μ = work in this research Stochastic (Random) were proxies variables. as follows:
The ROA empirical = Returnequation on Asset; models, TDR = Totalestimated Debt Ratio;in LTDRthis research work = Long-term Debtwere Ratio;proxies as follows: ROASTDR = Return on Asset; = Short-term DebtTDR = Total Ratio; DebtAge; FA= Firm Ratio; FG=LTDR = Long-term Firm Growth; Debt SG=Sales Ratio; Growth STDR = Short-term Debt Ratio; FA= Firm Age; FG= Firm Growth; SG=Sales Growth Model 1: ROA = !0 + !1TDRit + !2FAit + !3FGit + !4SGit + µ Model 1: ROA = β0 + β1TDRit + β2FAit + β3FGit + β4SGit + μ Model 2: ROA Model 2: ROA= β=0!+0 +β1!LTDR + β FA + β3FG 1LTDRitit + !22FAitit + !3FG it + + β4SG it !4SG it +itµ +μ Model 3: ROA = β0 + β1STDRit + β2FAit + β3FGit + β4SGit + μ Model 3: ROA = !0 + !1STDRit + !2FAit + !3FGit + !4SGit + µ
Independent Variables
                  Capital Structure                                     Dependent Variables
         Debt ratio: i.  Total debt
                     ii  Long-term debt                                        Profitability
                     iii Short-term debt                          *         Return on Assets (ROA)
                   Control variables
               -   Firm Age
         !     -   Firm growth
               -   Sales growth
                                                         )!
     !
5.0Empirical Results
Descriptive statistics was used to describe, in summary, the trend of the variables used in the study. Table 2 shows the mean, the median, the minimum, the maximum, the standard deviation, the skewness and the kurtosis of the dependent and independent variables in the study. The issue of outlier was solved by winsorizing all the continuous variables at 5% top and bottom before the computation, as suggested by Dixon (1980) that winsorization of data gives more stable results than trimmed means.
According to Tabachnick and Fidell (2007), Pallant (2011) and Griffin and Steinbrecher, (2013), outliers can be described as those variables with skewness value above the range of ± 3.3 and kurtosis above ± 10 range. The result presented in Table 2 below in respect to skewness and kurtosis indicated that all the variables are within the acceptable range.
| Std. | ||||||||
|---|---|---|---|---|---|---|---|---|
| Variable | Mean | Median | Min | Max | Skewness | Kurtosis | ||
| deviation | ||||||||
| Dependent | ||||||||
| variable | ROA | 0.026 | 0.034 | -0.207 | 0.206 | 0.096 | -0.590 | 3.562 |
| Independent | ||||||||
| variables | TDR LTDR STDR | 0.560 0.164 0.388 | 0.554 0.123 0.360 | 0.182 0.00 0.082 | 0.986 0.476 0.820 | 0.222 0.145 0.206 | 0.164 0.830 0.509 | 2.227 2.594 2.428 |
| Control | ||||||||
| variables | FA FG SG | 31.042 7.916 3.074 | 32 4.58 2.372 | 5 -20.93 -49.439 | 59 54.28 63.775 | 16.699 17.844 26.041 | 0.071 0.902 0.274 | 1.907 3.704 3.438 |
Note: TDR=Total debt ratio (Total debt/Total Assets), LTDR=Long-term debt ratio (Total long term debt/ Total Assets), STDR=Short term debt ratio (Total short-term debt/Total Assets), FA=Firm age (Number of years since incorporation), FG=Firm growth (Percentage change in total assets), SG=Sales growth (Percentage change in total sales)
From Table 2, ROA (return on assets) ranges from -0.207 to 0.206 with a mean of 0.026 and a standard deviation of 0.096. TDR ranges from 0.182 to 0.986 with a mean value of 0.560 and a standard deviation of 0.14. LTDR ranges from 0.00 to 0.476 with a mean value of 0.164 and a standard deviation of 0.145. This indicates that some of the sample firms are not with long term debts in their debt ratios. STDR ranges from 0.082 to 0.820 with a mean value of 0.388 and a standard deviation of 0.206 indicating that all the sample firms have elements of short term debts, some with over 80% short term debt.
Firm age (FA) rages from 5 years to 59 years with 31years mean value and a standard deviation of 17 years. Firm growth (FG) rages from -20.93 to 54.28 with an average value of 7.916 and a standard deviation of 17.844 Sales growth (SG) rages from -49.439 to 63.775 with 3.074 mean value and a standard deviation of 26.041.
Furthermore, the study also used variance inflated factors to detect critical multicollinearity. The general rule of thumb commonly used in empirical literature for determining the presence of critical multicollinearity is VIF≥10 or 1/VIF≤0.1 (see Gujarati 2004; Hair, Black, Babin, Anderson, & Talham 2006). The result, as indicated in Table 3, shows that the VIF values are below 10 and tolerance value are higher than 0.1.
| Variable | VIF | 1/VIF |
|---|---|---|
| FG | 1.09 | 0.9146 |
| TDR | 1.09 | 0.9171 |
| SG | 1.07 | 0.9321 |
| FA | 1.07 | 0.9339 |
| Mean VIF | 1.08 |
| ROA | TDR | LTDR | STDR | FA | FG | SG | |
|---|---|---|---|---|---|---|---|
| ROA 1 | |||||||
| TDR | -0.3109 1 | ||||||
| LTDR | -0.1755 | 0.4189 1 | |||||
| STDR | -0.1619 | 0.7483 | -0.2547 1 | ||||
| FA | -0.0001 | 0.2464 | -0.0459 | 0.294 1 | |||
| FG | 0.3724 | 0.1221 | -0.0067 | 0.1498 | -0.0424 1 | ||
| SG | 0.2611 | -0.0385 | -0.0128 | -0.0105 | -0.0238 | 0.251 1 | |
All the independent variables are below the threshold value of 0.90 as suggested by Pallant (2011). Table 4 reveals that all the debt ratio proxies via; TDR, LTDR and STDR are all negative correlated with ROA. Firm characteristics proxies via; FG and SG are positively correlated with ROA, while firm age (FA) is negatively correlated with ROA. However, the correlation matrix above quantifies the relationship between two variables but ignored which one is dependent and which one is explanatory variables. Regression model goes beyond correlation matrix by adding prediction capabilities and providing estimates of values of the dependent variables from the values of independent variables. Therefore, we conducted diagnostic test to determine the appropriate regression model for our study and base our relationship and prediction analysis on the result of the regression model used.
| (a) Testing for random effects |
| Breusch and Pagan Lagrangian multiplier test for random effects |
| Test: Var(u) = 0 |
| chibar2(01) = 179.81 |
| Prob > chibar2 = 0.0000 |
| (b) Hausman testing for fixed effects |
| Test: Ho: difference in coefficients not systematic |
| chi2(13) = (b-B)’[(V_b-V_B)^(-1)](b-B = 168.80 |
| Prob>chi2 = 0.000 |
| (c) Heterokedasticity Test |
| Breusch-Pagan / Cook-Weisberg test for heteroskedasticity |
| Ho: Constant variance |
| Variables: TDR, FA, FG, SG |
| chi2(4) = 16.93 |
| Prob > chi2 = 0.0020 |
| (d) Autocorrelation Test |
| Wooldridge test for autocorrelation in panel data |
| H0: no first-order autocorrelation |
| F( 1, 105) = 18.406 |
| Prob > F = 0.0000 |
Testing for random effects: The Breusch and Pangan Lagragian multiplier test for random effects was conducted after running the ordinary least square regression model. The null hypothesis is random effects while the alternate hypothesis is ordinary least square (OLS). The result in Table 5(a) provided a chi-square value of 179.81 and a corresponding probability-value of 0.0000. The result indicates that the null hypothesis cannot be rejected since the probability value is less than 0.05. (Baltagi 2005).
Hausman testing for fixed effects: This test was conducted after running the fixed effect model, so as to select between random effect and fixed effect. The test was conducted against the null hypothesis that preferred random effect but support fixed effect. The Hausman test results in Table 5(b) provided a chi-square value of 22.40 and a corresponding probability-value of 0.000. The result indicates that the null hypothesis cannot be rejected since the probability-value is less than 0.05 (Baltagi 2005).
Heterokedasticity Test: This test was conducted to know if the disturbances appearing in the population regression are homoskedasticity and constant serial correlation through the random individual effects (see Hsiao, 2003; Baltagi, Byoung, & Seuck, 2010). Table 5(c) presents the Breuch-Pagan/Cook-weisber test for heteroskedasiticity conducted in this study, the chi-square value was 16.93 and the probability-value of 0.0020 is significant. Therefore, we fail to accept the null hypothesis that there is constant variance, indicating the presence of heteroskedasiticity, and accept the alternate hypothesis which assumes the presence of unrestricted heteroskedasticity.
Autocorrelation Test: Wooldridge test for autocorrelation in panel data was conducted. The null hypothesis was that, there is no first-order autocorrelation. The results in Table 5(d) shows F (1,105) = 18.406 and prob.> F = 0.0000 (significant at 1%). We failed to accept that there is no first-order autocorrelation, we need a standard error estimate that is robust against the presence of unrestricted heteroskedaticity as it is recommended in Bailey and Katz (2011). Therefore “robust” fixed effect model was adopted for the study.
| ROA | Coef. | Std. Err. | t value | P>|t| | Significant |
|---|---|---|---|---|---|
| TDR | -0.11229 | 0.06008 | -1.87 | 0.064 | -ve sig |
| FA | -0.00143 | 0.00053 | -2.71 | 0.008 | -ve sig |
| FG | 0.00091 | 0.00023 | 3.96 | 0.000 | +ve sig |
| SG | 0.00044 | 0.00014 | 3.12 Influence of Capital Structure on Profitability: Empirical Evidence from Listed Nigerian Non-Financial Firms 1-16 | 0.002 | +ve sig (continued) 11 |
| ROA | Coef. | Std. Err. | t value | P>|t| Significant | |
| _cons | 0.12429 | 0.03215 | 3.87 | 0.000 | |
| sigma_u | 0.072473 | ||||
| sigma_e | 0.057674 | ||||
| Rho | 0.612256 | (fraction of variance due to u_i) | |||
| Prob > chi2 | = | 0.0000 | |||
| R-squared | = | 0.1495 |
Note: TDR=Total debt ratio (Total debt/Total Assets), LTDR=Long-term debt ratio (Total long term debt/ Total Assets), STDR=Short term debt ratio (Total short-term debt/Total Assets), FA=Firm age (Number of years since incorporation), FG=Firm growth (Percentage change in total assets), SG=Sales growth (Percentage change in total sales)
The results from model 1: Table 6 summarizes the TDR model estimations. As betokened by the outputs of the model 1, and in line with H1, the main IV (independent variables) – i.e. total debt ratio (TDR), is negatively and significantly influence the DV (dependent variable) - i.e. financial profitability (ROA) at a significance level of ten per cent (10%). The gradient coefficient of the total debt ratio variable (-0.11229; p 0.064), indicating that the higher the total debt ratio in the sample firms the lower the profitability (ROA). The control variables, firm age negatively and significantly influence the DV (ROA) at a significance of 1% whereas firm growth (FG) and sales growth (SG) positively and significantly influence the DV at a significance level of 1%.
| ROA | Coef. | Std. Err. | t value | P>|t| | Significant |
|---|---|---|---|---|---|
| LTDR | 0.0111704 | 0.0525468 | 0.21 | 0.832 | Not sig |
| FA | -0.0016074 | 0.0006176 | -2.6 | 0.011 | -ve sig |
| FG | 0.0007659 | 0.0002158 | 3.55 | 0.001 | +ve sig |
| SG | 0.0004628 | 0.0001347 | 3.43 | 0.001 | +ve sig |
| _cons | 0.0660925 | 0.0230234 | 2.87 | 0.005 | |
| sigma_u | 0.077884 | ||||
| sigma_e | 0.058985 | ||||
| Rho | 0.635502 | (fraction of variance due to u_i) | |||
| Prob > chi2 | = | 0.0000 | |||
| R-squared | = | 0.1104 |
The results from model 2: Table 7 summarizes the LTDR model estimations. As disclosed by the outputs of the complete model 2, and contrary with H1, the main IV – i.e. long total debt ratio (LTDR), is positive but insignificantly influence the DV (ROA). The gradient coefficient of the long term debt ratio variable (0.01117; p 0.832), indicating that the long term debt ratio of the sample firms has no significant influence of the profitability (ROA). The control variables, on the other hand, produced the same result as in model 1.
| ROA | Coef. | Std. Err. | t value | P>|t| | Significant |
|---|---|---|---|---|---|
| STDR | -0.1084736 | 0.0593114 | -1.83 | 0.070 | -ve sig |
| FA | -0.0013603 | 0.0005204 | -2.61 | 0.010 | -ve sig |
| FG | 0.0009138 | 0.0002284 | 4 | 0.000 | +ve sig |
| SG | 0.0004577 | 0.000134 | 3.42 | 0.001 | +ve sig |
| _cons | 0.101169 | 0.0209198 | 4.84 | 0.000 | |
| sigma_u | 0.076208 | ||||
| sigma_e | 0.057943 | ||||
| Rho | 0.633676 | (fraction of variance due to u_i) | |||
| Prob > chi2 | = | 0.0000 | |||
| R-squared | = | 0.1415 |
The results from model 3: Table 8 summarizes the STDR model estimations. As disclosed by the results of the complete model 3, and consistent with H1, the main IV – i.e. STDR, is negatively and significantly influence the DV (ROA) at a significance level of one per cent (10%). The gradient coefficient of the total debt ratio variable (-0.10847; p 0.070), indicating that the higher the STD ratio in the sample firms the lower the profitability (ROA). The control variables on the other hand, produced the same result as in model 1.
Overall, the empirical outcome revealed that debt ratios negatively influence the firms’ performance (ROA) in terms of financial profitability. Firms with a lesser debt ratio appears to be more profitable than those with higher debt ratio relating to agency theory assumption. Specifically, the principal (owners) and agents (managers) of profitable firms should make use equity financing and retained earnings efficiently, thereby reducing agency costs and staying independent of external debt financiers. This research work complement those of previous studies from other countries in emerging economy and firm contexts, e.g. Goddard, Tavakoli, and Wilson (2005), Abor (2007), Sheikh and Wang (2011), Salim and Yadav (2012); and Darush and Peter (2015). Influence of Capital Structure on Profitability: Empirical Evidence from Listed Nigerian Non-Financial Firms 1-16 13
| ROA | Significant | ROA | Significant | ROA | Significant |
|---|---|---|---|---|---|
| TDR | -ve sig | LTDR | Not sig | STDR | -ve sig |
| FA | -ve sig | FA | -ve sig | FA | -ve sig |
| FG | +ve sig | FG | +ve sig | FG | +ve sig |
| SG | +ve sig | SG | +ve sig | SG | +ve sig |
| _cons | _cons | _cons | |||
| Prob > chi2 | 0.0000 | Prob > chi2 | 0.0000 | Prob > chi2 | 0.0000 |
| R-squared | 0.1495 | R-squared | 0.1104 | R-squared | 0.1415 |
6.0Conclusion
CS decision making is important for the financial profitability of a firm. Debts financing and Equity financing are a firm’s main sources of financing its operation. Choosing the right proportion of debt and equity in CS ratio will assist in raising a firm’s financial profitability. Generally, it is assumed that debt allows firms to finance operations that they would not be able to do otherwise, however, it also raise the overall risk of the firm. Nevertheless, there is small divergence of opinion about the influence of debt financing on financial profitability. The literature disclosed distinct outcomes under distinct circumstances. This research work reveals a noticeable negatively relationship between TD (total debt) and profitability, STD and profitability, thus, the more the proportion of debt in capital structure, the less the financial profitability. The results are consistent with Osuji and Odita (2012) and agrees with Pecking order theory.
Debt financing appears to be highly costly due to some macroeconomic factors and financial crisis, thus raising the proportion of debt financing in CS will produce lower financial profitability. It can be noticed that profitability relates with control variables (firm growth and sales growth) positively. The outcome of this research work agrees with the studies of Mohammad and Jaafer (2012); Kebewar (2013) and Darush and Peter (2015). While the finding that firm age is negatively related with the profitability is consistent with Osuji and Odita (2012).
Recommendations
This study’s results indicate a negative relationship between debt financing and financial profitability, meaning that, increasing debt ratio most especially STD in capital structure will reduced financial profitability. Therefore, it is recommended that firms should prefer LTD which does not have much significant influence on profitability. The time period of this research work encompasses the years of economic recession in Nigeria (2015-2016), which affected firms’ performance over the time. That means there is still chance for improvement. I It was reported by Nigeria Bureau of Statistics toward the end of 2017, that Nigeria is out of recession, therefore, future research should consider increasing scope of study to make the results more reliable.
The study excluded firms in financial institution sector due to the nature of services rendered by the financial institutions which is quite different from the other sectors. Also, the study does not represent unlisted firms, the study focuses on firm listed on the Nigeria Stock Exchange, and the findings may not be generisable to all firms in Nigeria. Further studies could consider small and medium enterprises (SMEs) in Nigeria. This study could be considered as an addition to knowledge and to a series of studies and existing literature in the Nigeria context and globally in the area of capital structure and firm performance. It is expected to add to the body of literature as the study further throws more light on the effect of debt ratio on firms’ financial performance in Nigeria. Nigeria as a developing country aims to attract more foreign investors, provide better access of Nigerian firm to financing, less cost of capital, better returns to all the firms’ stakeholders and better firm performance to enhance the country’s economic growth and development. Sound and effective capital market practices must be put in place across all sources of firm financing in Nigeria.
References
- Abor, J. (2005). The Effect of Capital Structure on Profitability. An Empirical Analysis of listed firms in Ghana. The Journal of Risk Finance Incorporating Balance Sheet. 6(5), 10.
- Abu-Rub, N., (2012). Capital Structure and Firm Performance: Evidence from Palestine Stock Exchange. Journal of Money, Investment and Banking, 23(1), 109-117.
- Agarawal, R & Zhao, X. (2007). The Leverage–Value Relationship Puzzle: An Industry Effects Resolution. Journal of Economics and Business, 59, 286-297.
- Bailey, D., & Katz, J. N (2011). Implementing Panel-Corrected Standard Errors in R: The pcse Package. Journal of Statistical Software, Code Snippets 42(1), 1-11.
- Baltagi, B. H., Byoung, C. J, & Seuck, H. S., (2010). Testing for Heteroskedasticity and serial correlation in a random effects panel data model. Journal of Econometrics Elsevier, 154(2), 122-124.
- Baum, C.F. Schafer, D. & Talavera,O. (2006). The Effects of Short-Term Liabilities on Profitability: A Comparison of German and US Firms. Boston College Working Papers in Economics 636, Boston College Department of Economics, Massachusetts.
- Berle, A. & Means, G. (1932). The Modern Corporation and Private Property. Mc-Millan, New York.
- Bos T. & Fetherson (1993) Capital structure practices on the Pacific Rim. Research on International Business and Finance, 10, 53-66.
- Cheng, Y. Liu, Y. & Chien, C. (2010). Capital Structure and Firm Value in China Panel Threshold Regression Analysis. African Journal of Business Management, 4(12), 2500-2507.
- Danso, A., & Adomako, S. (2014). The financing behaviour of firms and financial crisis. Managerial Finance, 40(12), 1159-1174.
- Darush, Y & Peter Ö. (2015). Debt financing and firm performance: An empirical study based on Swedish data. The Journal of Risk Finance, 16(1), 102-118.
- Dixon, W. J. (1980). Efficient analysis of experimental observations. Annual Review of Pharmacology and Toxicology, 20, 441-462
- Dwilaksono, H. (2010). Effect of Short and Long Term Debt to Profitability in The Mining Industry Listed in JSX. Business and Entrepreneurial Review, 10(1), 77-87.
- Hassan, J. H., Faisal K. & Muhammad I. W. (2016). Impact of debt on profitability of firms; Evidence from non-financial sector of Pakistan. City University Research Journal, 6(1), 70-80.
- Goddard, J., Tavakoli, M. & Wilson, J. (2005). Determinants of profitability in European manufacturing and services: Evidence from a dynamic panel model. Applied Financial Economics, 15(18), 1269-1282.
- Griffin, M. M., & Steinbrecher, T. D. (2013). Large-scale datasets in special education research. International Review of Research in Developmental Disabilities, 45, 155-183
- Gujarati, D. N. (2004). Basic econometrics 4th edition, Tata McGraw-Hill, New Delhi.
- Hair, J., Black, W., Babin B., Anderson, R., & Talham, R. (2006). Multivariate Data Analysis. 6th edition, Pearson Prentice Hall, New Jersey.
- Jensen, M., & Meckling, W. (1976). Theory of the Firm: Managerial Behaviour, Agency Costs and Ownership Structure. Journal of Financial Economics, 3(6), 305-360.
- Kebewar, M. (2013). Does debt affect profitability? An empirical study of French trade Sector. Munich Personal RePEc Archive Paper No. 43968.
- Kraus, A. & Litzenberger, R. H. (1973). A state-preference model of optimal financial leverage. Journal of Finance, 28, 911-922.
- Lingsheng, M. Wang, Q. & Zhou, L. (2008). Political connections, financing and firm performance: Evidence from Chinese private firms. Journal of Development Economics, 87(2), 283-299.
- Lucey, B. M. & Zhang, Q (2011). Financial integration and emerging markets capital structure. Journal of Banking & Finance, 35(5), 1228-1238.
- Margaritis, D. & Psillaki,M.(2010). Capital Structure, Equity Ownership and Firm Performance, Journal of Banking and Finance, 34, 621-632.
- Modigliani, F., & Miller, M. H. (1958). The cost of capital, corporation finance and the theory of investment. The American Economic Review, 48(3), 261-287.
- Modigliani, F., & Miller, M. H. (1963). Corporate income taxes and the cost of capital: A correction. The American Economic Review, 53(3), 433-443.
- Mohammad & Jaafer (2012). The Relationship between Capital Structure and Profitability. International Journal of Business and Social Science 3(16).
- Myers, S. C., & Majluf, N. S. (1984). Corporate financing and investment decisions when firms have information that investors do not have. Journal of Financial Economics, 13, 187-221.
- Nwude, E. C., Idam O. I., Bamidele, O. A. & Sergius, N. U. (2016). The impact of debt structure of firm performance: Empirical evidence from Nigeria quoted firms, Asian Economic and Financial Review, 6(11), 647-660.
- Oke, O. & Afolabi, B. (2010). Capital Structure and Industrial Performance in Nigeria. International Business and Management, 2(1), 100-106.
- Onaolapo, A. A., & Kajola. S. O. (2010). Capital structure and firm performance: Evidence from Nigeria. European Journal of Economics, Finance and Administrative Sciences, 25, 70-82.
- Osuji, C. C. & Odita, A. (2012). Impact of capital structure on the financial performance of Nigerian firms. Arabian Journal of Business and Management Review, 1(12), 43-61.
- Pallant, J. (2011). SPSS Survival Manual: A step by step guide to data analysis using SPSS for windows 3rd edition. England: McGraw Hill Open University Press.
- Salim, M. & Yadav, R. (2012). Capital structure and firm performance: Evidence from Malaysian listed companies. Procedia – Social and Behavioral Sciences: International Congress on Interdisciplinary Business and Social Sciences, 65(1), 156-166.
- Sheikh, N. A., & Wang, Z. (2010). Financing Behavior of Textile Firms in Pakistan. International Journal of Innovation, Management and Technology, 1(2), 130-135.
- Tabachnick, B. G. & Fidell, L. S. (2007). Using multivariate statistics (5th edn). Boston: Pearson Education.