Factors Influencing Tourist's Satisfaction based on Service Attributes of Hotels: A Study on Cox's Bazar, Bangladesh
- Department of Tourism and Hospitality Management, Noakhali Science and Technology University, Noakhali-3814
Journal of Business Management and Accounting 9(1) (2019) · https://doi.org/10.32890/jbma2019.9.1.8744
Abstract
This study attempts to identify hotels service attributes that influence tourists’ satisfaction in the context of Cox’s Bazar, Bangladesh. Descriptive research was conducted to gain an insight into the topic and to investigate the factors. This paper reports findings based on a descriptive study. To conduct this study, a survey was administered to 300 respondents using a non-probability sampling which is a convenience sampling technique. To analyze the data, factor analysis, correlation, regression analysis and frequency distribution table was used. A conceptual model of tourist’s satisfaction based on service attributes of hotels in Cox’s Bazar was proposed based on factor and regression analysis. Seven factors emerged and were used as independent variables in the regression analysis. Findings indicate that some hotel service attributes have a direct influence on tourists’ satisfaction which make them loyal in the context of Cox’s Bazar.
Keywords: Tourists satisfaction, influence, service attributes, hotels, loyal tourists, Cox’s Bazar
2.0Literature Review
Tourists’ satisfaction is the outcome of their perception of the value received in a transaction or relationship, where value equal to perceived service quality, compared to the value expected from transactions or relationships with competing vendors (Blanchard & Galloway, 1994; Heskett et al., 1990; Zeithaml et al., 1990). In order to achieve tourists’ satisfaction, it is important to recognize and to anticipate their needs and to be able to satisfy them. Enterprises which are able to rapidly understand and satisfy tourists’ needs make greater profits than those that fail to understand and satisfy them (Barsky & Nash, 2003). Since the cost of attracting new tourists is higher than the cost of retaining the existing ones, in order to be successful, managers must concentrate on retaining existing tourists and implementing effective policies for tourists’ satisfaction and loyalty. This is especially true in the hotel industry. In most cases, hotels in Cox’s Bazar are trying to provide good quality facilities and service attributes according to tourists’ needs, wants and demands. Providing high quality service attributes and improving tourists’ satisfaction are widely recognized as fundamental factors that can boost the performance of companies in the hotel and tourism industry (Barsky & Labagh, 1992; Le Blanc, 1992; Le Blanc et al., 1996; Stevens et al., 1995, Opermann, 1998). Hotels with good service quality will ultimately improve their profitability (Oh & Parks, 1997). In the competitive hospitality industry which offers homogeneous service attributes, hoteliers must be able to satisfy customers better than their counterparts (Choi & Chou, 2001). To obtain loyalty and to outdo other competitors, hotel providers must be able to obtain high levels of tourists’ satisfaction for the service supplied. There are several studies that investigate the needs and desires of tourists. Many researchers and consultants argue that there must be strong ‘attitudinal commitment’ to a brand for true loyalty to exist (Day 1969; Jacoby and Chustnut 1978; Foxall and Goldsmith 1994; Mellens et. al. 1996; Reichheld 1996). This is seen as taking the form of a consistently favorable set of stated beliefs towards the brand. These attitudes may be measured by asking how much people say they like the brand, feel committed to it, will recommend it to others, and have positive beliefs and feelings about it – relative to competing brands (Dick and Basu, 1994). A research by Wuest et al. (1996) defined the perception of hotel attributes as the degree to which guests may find various service attributes and facilities critical for their stay in a hotel. Hotel’s attributes such as cleanliness, price, location, security, personal service, physical attractiveness, opportunities for relaxation, standard of service attributes, appealing image, and reputation are recognized as decisive by travelers to assess the quality of hotels (Atkinsons, 1988; Ananth et al.,
1992; Barsky & Labagh, 1992; Cadotte & Turgeon, 1988; Knutson, 1988; McCleary et al., 1993; Rivers et al., 1991; Wilensky & Buttle, 1988). Nowadays one of the biggest challenges for managers in the hotel industry is to provide and sustain tourists’ satisfaction. Tourists’ requirements for quality products and services have become increasingly evident to professionals (Lam & Zhang, 1999; Yen & Su, 2004). Guest relationship is a strategic asset of the organization (Gruen et al., 2000) and tourists’ satisfaction is the starting point to define business objectives. Hotels are increasing their investments to improve service quality and the perceived value for guests so as to achieve better tourists’ satisfaction and loyalty, thus resulting in better relationships with tourists (Jones et al., 2007). Relationship quality has a remarkable positive effect on hotel guests’ behavior: it creates positive word of mouth (WOM) and increase repeated guest rates (Kim et al., 2001). Quality of service is the key factor by which we can differentiate service products. High quality products and service attributes can secure the tourists satisfaction (Getty & Getty, 2003; Gupta & Chen, 1995; Tsang & Qu 2000). Tourists may perceive the same service in different ways; they may have different values and different grounds for assessing service quality. The concept of service should be approached from the tourists’ points of view, since it is their perception of the outcome that constitute the service (Edvardsson, 1996). According to a survey carried out by Barsky & Nash in 2006, regarding the main hotel chains worldwide, between 2002 and 2005, the importance of loyalty programs for guests’ decision on where to stay increased from 32% to 34%. Although the search for new locations is certainly the most important factor for many tourists, several studies highlighted that there is a good portion of tourists that chose to repeat their holiday destinations, showing a certain degree of loyalty (Oppermann, 1998; Fyall et al., 2003).These studies on tourists’ loyalty indicate five main factors that affect repetition of trips to the same tourist destination: the desire to reduce the risk of making a mistake when choosing an alternative destination; the chance to meet the same people again; the emotional attachment to a specific place; the possibility of exploring a better place and the desire to show the place to other people. Hoteliers need to fully acknowledge which service attributes are most likely to influence tourists’ choices in their own contexts (Richard & Sundaram, 1993). Tourists’ satisfaction determinants can help hoteliers to identify crucial elements affecting tourists’ purchase experience and post-purchase behavior such as subsequent purchase and favorable word of mouth (WOM) publicity (Berkman & Gilson, 1986; Choi &Chu, 2001; Fornell, 1992; Halstead & Page, 1992; Knutson, 1988; Pizam, 1994). A satisfied guest promotes positive WOM at no cost to the enterprise and with effect and credibility that are superior to those of conventional advertising (Lee et al., 2006, Tarn, 2005, Villanueva et al., 2008). Tourists’ satisfaction is the starting point of building tourists’ loyalty, therefore a long-term relationship. This creates a loyalty stock in the enterprise and improves corporate image. The consolidation of relations with guests leads to repeated patronage. On the other hand, an unsatisfied tourist may represent a danger for the enterprise. A research, conducted by Cherubini (1997), shows that only 4% of unsatisfied tourists complain to the business explaining the reason of their dissatisfaction, and each client who doesn’t officially complain generates a negative WOM which can involve other 1000 people. Tourist perceptions
Factors Influencing Tourist's Satisfaction based on Service Attributes of Hotels: A Study on Cox's Bazar, Bangladesh 27-54 are important to successful destination marketing because they influence the choice of a destination Ahmed 1991), the consumption of goods and service attributes while on holiday, and the decision to return (Stevens 1992). The majority of tourists have experiences with other destinations and their perceptions are influenced by comparisons between facilities, attractions, and service standards (Laws 1995). Assessing tourists’ satisfaction compared with product performance and feedback received from tourists can help managers improve their service performance (Fornell, 1992). To date, much marketing research involves determining the factors influencing tourists’ satisfaction or dissatisfaction. Wang and Qu (2006) investigated tourists’ satisfaction using twelve variables such as accommodations, shopping facilities, and restaurant facilities, quality of accommodation, personal safety, tourist information, beach cleanness, and state of the roads, beach promenades, drinkable water, and traffic flow and parking facilities. Alegre and Garau (2010) examined dissatisfaction at a sun and sand tourist destination called the island of Majorca in the Balearic Islands. The following attributes were rated in terms of satisfaction; climate, cleanliness and hygiene, scenery, peace and quiet, accommodation, safety, historic sites or places, presence of friends and family, interaction with other tourist, night life, sports activities, tourist attractions, prior visits to the destination, ease of access, facilities for children, easy access to information, local cuisine, local lifestyle, and affordable prices.
3.0Conceptual Model
Tourist Satisfaction Concept
Satisfaction is the evaluation of the performance of the overall services provided by the firm and received by the customers (Skogland and Siguaw, 2001). Satisfaction is an important factor to be taken into account by tourists in deciding whether to continue a purchase or otherwise. Satisfaction occurs when performance exceeds expectation (Bitner, 1990). On the other hand, when expectation exceeds performance, dissatisfaction will occur (Parasuraman et al.1990). 3.2
Tourists’ Loyalty Concept
Tourists’ loyalty is a deeply held commitment to rebuy or re-patronize a preferred product/service consistently in the future, thereby causing repetitive purchasing despite situational influences and marketing efforts which has the potential to cause switching behavior. 3.3
Service and Service Attributes Concept
The American Marketing Association defines services marketing as an organizational function and a set of processes for identifying or creating, communicating, and delivering value to tourists and for managing tourists’ relationships in a way that benefit the organization and stakeholders. Services are (usually) intangible economic activities offered by one party to another. The attribute package offered by the service provider includes the quality of infrastructure and equipment and staff performance (Sasser et al., 1978), the core service, peripheral services and the production system. All these aspects contribute to consumer satisfaction. For Zeithaml and Bitner (2000), consumer satisfaction can be assessed by identifying the important attributes and measuring the perception of these attributes and overall satisfaction. 3.4
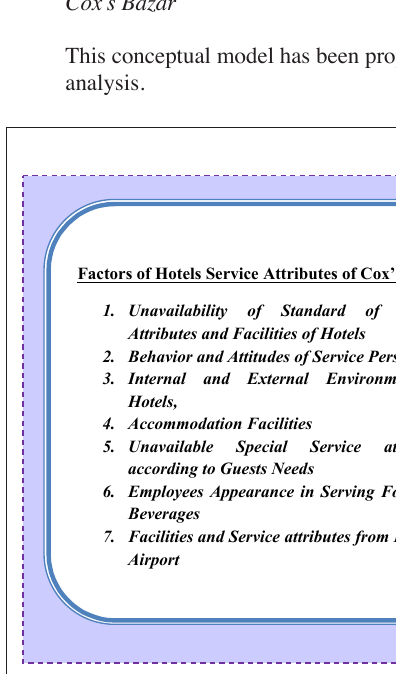
Proposed Model of Tourists Satisfaction based on Service Attributes of Hotels in Cox’s Bazar This conceptual model has been proposed based on factor and regression analysis.
Factors of Hotels Service Attributes of Cox’s Bazar
1. Unavailability of Standard of Service Attributes and Facilities of Hotels! 2. Behavior and Attitudes of Service Personnel! Tourists 3. Internal and External Environment of Satisfaction Hotels,! 4. Accommodation Facilities! 5. Unavailable Special Service attributes according to Guests Needs! 6. Employees Appearance in Serving Food and Beverages! Objectives of the Study TheFacilities aim of thisand study is to investigate analyze thetofactors of service attributes of hotels 7. Service attributesand from Hotel Airport! Tourists
4. Objectives of the Study 3.5
Loyalty
Broad Objective
Figure
1. A Proposed Model of Tourists Satisfaction based on Service attributes ! of Hotels in Cox's Bazar To investigate the service attributes of hotels at Cox’s Bazar, Bangladesh that affect tourists’ satisfaction.
Factors Influencing Tourist's Satisfaction based on Service Attributes of Hotels: A Study on Cox's Bazar, Bangladesh 27-54
Specific Objectives
To investigate the quality of service attributes of Cox’s Bazar hotels from 1star to 5 star. To investigate tourists’ satisfaction and loyalty based on service attributes of hotels at Cox’s Bazar and whether they will recommend to others based on words of mouth communication (WOM). To make recommendations for all tourism stakeholders, hoteliers and the local communities to maximize the benefits of this sector and for the development of hotel services.
4.0Methodology
Research Design
The study is basically descriptive in nature. Quantitative approach was adopted to analyze data obtained from respondents. According to Best and Kahn (1998), descriptive study interprets situations, conditions or relationships as they exist. They also elaborated that descriptive studies deal with the relationships between variables, tests hypotheses and develops principles, theories and generalizations having universal validity. 4.2
Type & Approach of Study
This study is a descriptive research and data was collected using a purposive sampling method. To conduct this study, quantitative data was collected through a survey. The survey questionnaire consists of a total of 36 vital sample questions. These questions contain 29 variables used to conduct factor analysis. Furthermore, one dependent variable was used to conduct regression analysis with independent variables obtained from the factor analysis. Finally, 6 variables constituting socio-demographic characteristics of respondents were analyzed. 4.3
Research Context & Data Sources
In order to achieve the objectives and to test hypotheses, necessary information was gathered from both primary and secondary sources to attain the research objective. Primary data was obtained through a questionnaire administered on respondents who have already visited Cox’s Bazar. Secondary data and Statistical data were collected from Bangladesh Parjatan Corporation (BPC), Bangladesh Tourism Board (BTB), Bangladesh Bureau of Statistics (BBS), Tourism Operators Association of Bangladesh (TOAB), Association of Tourism Agency of Bangladesh (ATAB), Ministry of Civil Aviation & Tourism (MoCAT), Government of Bangladesh (GoB), National Hotel & Tourism Training Institute (NHTTI), Dhaka University ( DU), NGO, and Tourism Stakeholders. Moreover, some data were gathered from review of available documents, online and printed articles.
Measurement & Scaling Techniques
For scaling purpose, the 5-point Likert Scale of the itemized rating scale (Noncomparative Scaling) was used. Respondents were asked to rate thirty (30) variables of service attributes of hotels on a 5-point Likert Scale from Strongly Agree (SA) , Agree (A), Neutral (N), Disagree (D) and Strongly Disagree (SD) relative to whether or not the significant factors of service attributes of hotels influences tourists satisfaction in Cox’s Bazar, Bangladesh. 4.5
Sample Size, Sampling Technique & Data Collection Procedure
4.5.1Target population
Elements: Both male and female respondents (aged between 15 to 65) Target Group: Local residents, tourists, businessmen, students, backpackers, short-term visitors, culture-seekers, adventurous nature-lovers. Time: From 20th July, 2018 to 20th January, 2019
4.5.2Sampling Technique and Sample Size
Data was collected using a convenience sampling (non-probability) sampling with the total sample size at 300. Males and females of various ages between 15 to 60 were selected. Among the 300 respondents sampled, 168 are males and 132 are females. 4.6
Statistical Techniques Used to Analyze the Data
Factor and regression analysis (dependence techniques) of multivariate techniques was utilized. SPSS (a popular computer program for analyzing marketing data) was the software used. The data was collected on 36 variables and among them six variables were demographic and 30 are vital service attributes. For the purpose of data reduction and summarization, relationships among sets of many interrelated variables were examined and represented in terms of few underlying factors. At the beginning, the data was factor analyzed using principal components analysis with varimax rotation and personal correlation to come up with a set of small number of uncorrelated factors. As a result of this, factor analysis was used in subsequent multivariate analysis, principal component analysis was also used. From about 29 major variables, seven (7) factor solutions resulted and were used as independent variables (metric) in the regression analysis. Tourists’ satisfaction served as the dependent variable (metric). Then multiple regression analysis was conducted to show how the dependent variable changes in response to the changes in independent variables.
Factors Influencing Tourist's Satisfaction based on Service Attributes of Hotels: A Study on Cox's Bazar, Bangladesh 27-54
5.0Approach to the Problem
Analytical Model (Mathematical)
For the Factor Analysis: Fi = Wi1X1+Wi2X2+Wi3X3+……………………. +WikXk Where, Fi = Estimate of the ith factor Wi = Weight or factor score coefficient K = Number of variables I1= Standard accommodation services
I2= Quality of food and beverage services
I3=Overall atmosphere inside and outside hotels
I4=Prompt attention to Safety and Security
I5= Cleanliness of environment
I6= Quality hygiene and sanitation
I7= Bill payment procedures (cash, debit card, credit or master/visa card, Bkash, Upay, DBBL mobile banking)
I8=Availability of entertainment and sports facilities
I9=arrangements of nightlife for tourists enjoyment
I10=Helpful attitude of employees towards tourists
I11= Responsiveness of tourists complaints
I12= Employees level of proficiency in English in handling foreign tourists
I13= Skillful employees in handling guests query
I14= Promptness response in case of emergency service (medicine, hospital, fire)
I15= Special facilities for children (swimming pool, baby sitter, cradle)
I16= Timely service in guests needs
I17= Swimming pool, beauty parlor, gymnasium, spa facilities according to tourists demand
I18=Well groomed appearance of employees
I19=Special services and facilities (Wi-Fi, audio visual, projector room for business seminar, iron machine, cradle, candle light dinner, pasty/cake for birthday/ anniversary celebration)
I20= Delivery of promising services
I21=Hotel escorting services (in case of outdoor attractions, museum, other destinations)
I22= Standard reservation systems
I23= Reasonable service costs
I24=Friendliness attitudes of doorkeepers
I25=Available parking facilities
I26=Shopping facilities adjacent to hotel
I27=Knowledgeable employees in case of guests information
I28= Variety of menu with different languages
I29= Convenient location from hotel to airport/ bus stands
I30=Tourists satisfaction
For the Regression Analysis: Y= a+b1i1+b2i2+b3i3+…………………………. +bkik Where, Y= Dependent or Criterion Variable x= Independent or Predictor Variable a= Intercept of the Line b1= Slope of the Line 5.2
Hypothesis and Data Analysis Tools
For the quantitative analysis, the following hypotheses were developed: Hypothesis-1: H0: There is no correlation among the set of identified factors of hotel service attributes in Cox’s Bazar that affect tourist’s satisfaction which means the twenty-nine (29) identified variables are uncorrelated. H1: The variables are highly correlated. Hypothesis-2: H0: No relationship exists between the dependent variable (tourist’s satisfaction) and the independent variables (obtained uncorrelated factors, i.e. unavailability of standard of services and facilities of hotels, behavior and attitudes of service personnel, internal and external environment of hotels, accommodation facilities , unavailable special services according to guests needs, employees appearance in serving food and beverages, facilities and services from hotel to airport) that form tourists satisfaction based on hotel service attributes in Cox’s Bazar. H1: There is relationship between tourists’ satisfaction based on hotel service attributes at Cox’s Bazar and the uncorrelated factors. The final analysis was performed using different statistical techniques, namely, factor analysis, correlation, multiple regression and descriptive statistics via SPSS 20.0 program.
6.0Results and Discussions
Factor Analysis
There are twenty-nine (29) variables, most of which are correlated and which should be reduced to a manageable level. By using factor analysis, the whole set of
Factors Influencing Tourist's Satisfaction based on Service Attributes of Hotels: A Study on Cox's Bazar, Bangladesh 27-54 interdependent relationships among variables were examined. Using varimax rotation, twenty-nine (29) variables were reduced to seven (7) uncorrelated factors having Eigen Value greater than 1.0. Principal Component Analysis was selected to determine the minimum number of factors that will account for maximum variance in the data for use in subsequent multivariate analysis.
6.1.1Testing Hypothesis-1: KMO and Bartlett’s Test
The null hypothesis, that the twenty-nine (29) variables are uncorrelated is rejected by the Barlett’s test of sphericity (Table 1). A large value of the test statistic favors the rejection of the null hypothesis. From the table, it was found that the approximate chi-square statistics is 7662.599 with 406 degrees of freedom which is significant at .05 levels. Besides, high values (between .5 and 1.0) of KMO measure of sampling adequacy indicate that the factor analysis is appropriate. Here, as the value of the KMO statistic (Table 1) is .778, the factor analysis is considered an approximate technique for analyzing the data.
| KMO and Bartlett’s Test | |
|---|---|
| Kaiser-Meyer-Olkin Measure of Sampling Adequacy | .778 |
| Bartlett’s Test of Sphericity Approx. Chi-Square | 7662.599 |
| df | 406 |
| Sig. | .000 |
6.1.2Initial Eigen values and Extraction Sums of Squared Loadings
The Eigen value for a factor indicates the total variance attributed to the factor. The total variance accounted by all the twenty-nine variables is 29, which is equal to the number of variables. Factor 1 account for a variance of 8.022, which is (8.022/29) or 27.662% of the total variance. Likewise, the next six factors (4.232/29), (3.254/29), (2.133/29), (1.640/29), (1.292/29) and (1.168/29) account for 14.594%, 11.221%, 7.357%, 5.655%, 4.456% and 4.028% of the total variance respectively. Here the first seven (7) factors combined account for 74.971% of the total variance. The ‘Extraction Sums of Square Loadings’ shows the variances associated with the factors that are retained. These are the same as under ‘Initial Eigen Values’.
| Total Variance Explained | |||||||||
|---|---|---|---|---|---|---|---|---|---|
| Component | Initial Eigen values | Extraction Sums of Squared Loadings | Rotation Sums of Squared Loadings | ||||||
| Total | % of | Cumulative % | Total | % of | Cumulative % | Total | % of | Cumulative % | |
| Variance | Variance | Variance | |||||||
| 1 | 8.022 | 27.662 | 27.662 | 8.022 | 27.662 | 27.662 | 6.347 | 21.886 | 21.886 |
| 2 | 4.232 | 14.594 | 42.255 | 4.232 | 14.594 | 42.255 | 3.945 | 13.605 | 35.491 |
| 3 | 3.254 | 11.221 | 53.476 | 3.254 | 11.221 | 53.476 | 3.001 | 10.350 | 45.840 |
| 4 | 2.133 | 7.357 | 60.833 | 2.133 | 7.357 | 60.833 | 2.690 | 9.277 | 55.118 |
| 5 | 1.640 | 5.655 | 66.487 | 1.640 | 5.655 | 66.487 | 2.655 | 9.155 | 64.273 |
| 6 | 1.292 | 4.456 | 70.943 | 1.292 | 4.456 | 70.943 | 1.720 | 5.931 | 70.204 |
| 7 | 1.168 | 4.028 | 74.971 | 1.168 | 4.028 | 74.971 | 1.382 | 4.766 | 74.971 |
| 8 | .964 | 3.323 | 78.294 | ||||||
| 9 | .792 | 2.732 | 81.027 | ||||||
| 10 | .748 | 2.579 | 83.605 | ||||||
| 11 | .651 | 2.244 | 85.849 | ||||||
| 12 | .628 | 2.167 | 88.016 | ||||||
| 13 | .507 | 1.748 | 89.764 | ||||||
| 14 | .440 | 1.519 | 91.283 | ||||||
| 15 | .382 | 1.317 | 92.600 | ||||||
| 16 | .301 | 1.036 | 93.636 | ||||||
| 17 | .293 | 1.011 | 94.647 | ||||||
| 18 | .269 | .928 | 95.575 | ||||||
| 19 | .215 | .742 | 96.317 | ||||||
| 20 | .201 | .692 | 97.009 | ||||||
| 21 | .165 | .568 | 97.577 | ||||||
| 22 | .148 | .510 | 98.087 | ||||||
| 23 | .140 | .482 | 98.569 | ||||||
| 24 | .117 | .403 | 98.972 | ||||||
| 25 | .081 | .279 | 99.251 | ||||||
| 26 | .072 | .248 | 99.499 | ||||||
| 27 | .061 | .212 | 99.711 | ||||||
| 28 | .047 | .163 | 99.875 | ||||||
| 29 | .036 | .125 | 100.000 | ||||||
6.1.3Determining the Number of Factors
The numbers of factors have been determined based on several considerations: (i) Eigen Value (only seven (7) factors with Eigen values greater than 1.0 are retained, [Table 2]); (ii) Scree plot ( the plot [Fig 2] has a distinct break ( at seven factors between the steep slope of factors, with large Eigen values and gradual trailing off (Scree) associated with the rest of the factors); (iii) percentage of variance ( the factors extracted should account for at least 60% of the variance and here, the first seven (7) factors account for 74.971% of the total variable (Table 2).
Factors Influencing Tourist's Satisfaction based on Service Attributes of Hotels: A Study on Cox's Bazar, Bangladesh 27-54
Eigenvalue
Scree Plot
Component Number

6.1.4Rotated Component Matrix
| Component | |||||||
|---|---|---|---|---|---|---|---|
| 1 | 2 Figure 33: (Bar Chart) | 4 | 5 | 6 | 7 | ||
| I1 | .032 | .245 | -.026 | .880 | .002 | -.073 | -.156 |
| From Table 7 and | |||||||
| I2 Figure 3,.891 | we can see. that among | .007300 sample | .057 size, 168 | .305respondents -.076 are male | .030 and 132 are | ||
| the female. I3 -.008 | .021 | .771 .112 | .163 | .211 .228 | |||
| 6.3.2 Age I4 | .705 | .267 | -.004 | .058 | -.077 | .130 | -.014 |
| I5 | .577 | -.523 | .106 | -.312 | .309 | .069 | -.185 |
| I6 | .222 | .070 | .271 | .169 | -.417 | -.008 | .340 |
| I7 | .848 | .185 | .063 | .226 | -.060 | .082 | -.096 |
| I8 | .190 | -.148 | -.184 | .629 | .068 | .425 | .203 |
| I9 | .748 | .326 | -.091 | .309 | -.137 | .167 | .001 |
| I10 | .286 | .633 | -.031 | .578 | -.045 | -.005 | -.018 |
| I11 | .741 | .409 | .081 | .210 | -.185 | .223 | .121 |
| I12 | -.131 | -.894 | -.116 | -.081 | -.102 | -.084 | -.153 |
| I13 | .242 | .534 | -.068 | .456 | .053 | .322 | .352 |
| I14 | .589 | .287 | .190 | -.203 | -.360 | -.008 | .067 |
| I15 | .127 | .625 | -.280 | ||||

6.3.2Age
(continued)
Component
Extraction Method: Principal Component Analysis. Rotation Method: Varimax with Kaiser Normalization. a. Rotation converged in 17 iterations.
A seven (7) factor solution resulted from the 29 variables, with the factors being labeled as: 1.
Unavailability of standard of I2= Quality of food and beverage services, , I4=Prompt services and facilities of hotels Safety and Security, I5= Cleanliness of environment , (I1) I7= Bill payment procedures (cash, debit card, credit or master/visa card, Bkash, Upay, DBBL mobile banking), I9=arrangements of nightlife for tourists enjoyment, I11= Responsiveness of tourists complaints, I14= Promptness response in case of emergency service (medicine, hospital, fire), I17= Swimming pool, beauty parlor, gymnasium, spa facilities according to tourists demand, I22= Standard reservation systems, I27=Knowledgeable employees in case of guests information, Behavior and attitude of service personnel (I2)
I5= Cleanliness of environment, I10=Helpful attitude of employees towards tourists, I12= Employees level of proficiency in English to handle foreign tourists, I13= Skillful employees in handling guests query, I15= Special facilities for children ( swimming pool, baby sitter, cradle), I21=Hotel escorting services (outdoor attractions, museum, other destinations), I23= Reasonable service costs (continued)
Factors Influencing Tourist's Satisfaction based on Service Attributes of Hotels: A Study on Cox's Bazar, Bangladesh 27-54
Internal and external environment of hotels (I3)
I3=Overall atmosphere of inside and outside of hotels ,I16= Timely service in guests needs, I20= Delivery of promising services, I23= Reasonable service costs, I25=Available parking facilities
4. Accommodation facilities (I4) I1= Standard accommodation services, I8=Availability of entertainment and sports facilities, I10=Helpful attitude of employees towards tourists 5.
Unavailable special services I16= Timely service in guests needs, I19=Special services according to guests needs (I5) and facilities (Wi-Fi, audio visual, projector room for business seminar, iron machine, cradle, candle light dinner, pasty/cake for birthday/anniversary celebration), I24=Friendliness attitudes of doorkeepers, I25=Available parking facilities
Employees appearance in I18=Well groomed appearance of employees, I28= Variety serving food and beverages of menu with different languages (I6)
Facilities and services from I29= Convenient location from hotel to airport/bus stands hotel to airport (I7)
6.1.5Correlation
The study attempted to investigate the factors influencing satisfaction with hotel services at Cox’s Bazar. All the aforementioned variables are correlated with each other. For this reason, the Pearson Moment correlation was applied in determining the association of each variable. The results are shown in the following table:
| Unavailability | Behavior | Internal | Accommodation Unavailable Employees | Facilities | ||||
|---|---|---|---|---|---|---|---|---|
| of standard of and attitudes and external facilities (I4) | special | appearance | and services | |||||
| services and | of service | environment | services | in serving | from hotel | |||
| facilities of | personnel (I2) of hotels (I3) | according to | food and | to airport | ||||
| hotels (I1) | guests needs beverages | (I7) | ||||||
| (I5) | (I6) | |||||||
| Unavailability | Pearson | 1 | .000 | .000 | .000 | .000 | .000 | .000 |
| of standard of | Correlation | |||||||
| services and | Sig. | 1.000 | 1.000 | 1.000 | 1.000 | 1.000 | 1.000 | |
| facilities of | (2-tailed) | |||||||
| hotels (I1) | N | 300 | 300 | 300 | 300 | 300 | 300 | 300 |
| Behavior | Pearson | .000 | 1 | .000 | .000 | .000 | .000 | .000 |
| and attitudes | Correlation | |||||||
| of service | Sig. | 1.000 | 1.000 | 1.000 | 1.000 | 1.000 | 1.000 | |
| personnel (I2) | (2-tailed) N | 300 | 300 | 300 | 300 | 300 | 300 | 300 |
| Internal | Pearson | .000 | .000 | 1 | .000 | .000 | .000 | .000 |
| and external | Correlation | |||||||
| environment of | Sig. | 1.000 | 1.000 | 1.000 | 1.000 | 1.000 | 1.000 | |
| hotels (I3) | (2-tailed) N | 300 | 300 | 300 | 300 | 300 | 300 | 300 |
| Accommodation | Pearson | .000 | .000 | .000 | 1 | .000 | .000 | .000 |
| facilities (I4) | Correlation Sig. (2-tailed) N | 1.000 300 | 1.000 300 | 1.000 300 | 300 | 1.000 300 | 1.000 300 | 1.000 300 |
| Unavailable | Pearson | .000 | .000 | .000 | .000 | 1 | .000 | .000 |
| special services | Correlation | |||||||
| according to | Sig. | 1.000 | 1.000 | 1.000 | 1.000 | 1.000 | 1.000 | |
| guests needs | (2-tailed) | |||||||
| (I5) | N | 300 | 300 | 300 | 300 | 300 | 300 | 300 |
| Employees | Pearson | .000 | .000 | .000 | .000 | .000 | 1 | .000 |
| appearance in | Correlation | |||||||
| serving food | Sig. | 1.000 | 1.000 | 1.000 | 1.000 | 1.000 | 1.000 | |
| and beverages | (2-tailed) | |||||||
| (I6) | N | 300 | 300 | 300 | 300 | 300 | 300 | 300 |
| Facilities and | Pearson | .000 | .000 | .000 | .000 | .000 | .000 | 1 |
| services from | Correlation | |||||||
| hotel to airport | Sig. | 1.000 | 1.000 | 1.000 | 1.000 | 1.000 | 1.000 | |
| (I7) | (2-tailed) N | 300 | 300 | 300 | 300 | 300 | 300 | 300 |
of standard of and attitudes and external facilities (I4) special appearance services and of service environment services in serving facilities of personnel (I2) of hotels (I3) according to food and hotels (I1) guests needs beverages (I5) (I6)
Facilities and services from hotel to airport (I7)
Unavailability of standard of services and facilities of hotels (I1)
Pearson Correlation
Behavior and attitudes of service personnel (I2)
Pearson Correlation
Internal and external environment of hotels (I3) Accommodation facilities (I4)
Sig. (2-tailed)
Sig. (2-tailed)
Pearson Correlation
Sig. (2-tailed) N
Pearson Correlation
Sig. (2-tailed) N
Unavailable special services according to guests needs (I5)
Pearson Correlation
Employees appearance in serving food and beverages (I6)
Pearson Correlation
Facilities and services from hotel to airport (I7)
Pearson Correlation
Sig. (2-tailed)
Sig. (2-tailed)
Sig. (2-tailed) N
Regression Analysis
The seven (7) factors that were identified from the factor analysis were used as independent variables (metric) while the dependent variable (metric) is tourists’ satisfaction. In order to examine the predictability of tourists’ satisfaction through the factors of hotel service attributes in Cox’s bazar, multiple regression analysis was conducted. The results are presented in the following table:
Factors Influencing Tourist's Satisfaction based on Service Attributes of Hotels: A Study on Cox's Bazar, Bangladesh 27-54
| Model Summary |
| Model |
| R |
| R Square Adjusted R |
| Square |
| .774a |
| .599 |
| .590 |
| Std. Error of |
| the Estimate |
| .66112 |
| Change Statistics |
| R Square |
| Change |
| F Change |
| df1 |
| df2 |
| Sig. F Change |
| .599 |
| 62.401 |
| .000 |
a. Predictors: (Constant), Unavailability of standard of services and facilities of hotels (I1), Behavior and attitudes of service personnel (I2), Internal and external environment of hotels (I3), Accommodation facilities (I4), Unavailable special services according to guests needs (I5), Employees appearance in serving food and beverages (I6), Facilities and services from hotel to airport (I7) ANOVA
Model
Sum of Squares df
Mean Square
Sig.
Regression
Residual
Total
a. Dependent Variable: Tourists Satisfaction b. Predictors: (Constant), Unavailability of standard of services and facilities of hotels (I1), Behavior and attitudes of service personnel (I2), Internal and external environment of hotels (I3), Accommodation facilities (I4), Unavailable special services according to guests needs (I5), Employees appearance in serving food and beverages (I6), Facilities and services from hotel to airport (I7)
6.2.1Strength of Association
Model summary (Table 5) shows that, the multiple correlation coefficients, R is .774. That means there is a significant positive relationship between the dependent and independent variables. So tourists’ satisfaction is highly correlated with the identified predictors (Unavailability of standard of services and facilities of hotels (I1), Behavior and attitudes of service personnel (I2), Internal and external environment of hotels (I3), Accommodation facilities (I4), Unavailable special services according to guests needs (I5), Employees appearance in serving food and beverages (I6), Facilities and services from hotel to airport (I7)). The strength of association in multiple regression is measured by the coefficient of multiple determination, R Square which is .599. That means 59% of the tourists’ satisfaction is influenced by the factors of hotel service attributes in Cox’s Bazar which is accounted for by the variation in unavailability of standard of services and facilities of hotels, behavior and attitudes of service personnel, internal and external environment of hotels, accommodation facilities, unavailable special services according to guests needs, employees’ appearance in serving food and beverages, facilities and services from hotel to airport. It is then adjusted for the number of independent variables and the sample size to account for diminishing returns and the Adjusted R Square is .590 and Standard Error of the Estimate is .66112. The value of Adjusted R Square is close to the R Square. This suggests that all the independent variables contribute to explaining tourists’ satisfaction.
6.2.2Testing Hypothesis-2
6.2.2.1 Significance of the Overall Regression Equation (ANOVA (b)) The F test is used to test the null hypothesis for the overall test that the coefficient of multiple determination in the population, R square (pop) = 0. Here R square= .599 which means the null hypothesis can be rejected. This is equivalent to testing the null hypothesis: H0: β1= β2= β3= β4= β5= β6=0. Analysis of variance (Table 5) shows that the overall test is conducted by using an F statistic where, F=62.401 which means the relationship is significant at α = .05 level with 7 and 292 degrees of freedom. ’s value associated with each of the independent variables for the model is not same and that means the null hypothesis can be rejected. So, it can be concluded that tourist’s satisfaction is explained by unavailability of standard of services and facilities of hotels, behavior and attitudes of service personnel, internal and external environment of hotels, accommodation facilities, unavailable special services according to guests needs, employee’s appearance in serving food and beverages, facilities and services from hotel to airport. The explained variables have varying level of influences and have positive or negative impacts on tourists’ satisfaction based on hotel service attributes in Cox’s Bazar. 6.2.2.2 Significance of the Partial Coefficients (Coefficients (a)) The above table presents the regression coefficient of the independent variables. Analysis of coefficient shows which independent variables have a significant relationship with the dependent variable as well as the importance of each independent variable. Analysis of the coefficient suggests that factors of hotel service attributes in Cox’s Bazar such as unavailability of standard of services and facilities of hotels, behavior and attitudes of service personnel, internal and external environment of hotels, accommodation facilities, unavailable special services according to guests needs, employee’s appearance in serving food and beverages, facilities and services from hotel to airport have a strong influence on tourists satisfaction in hotels of Cox’s Bazar.
Factors Influencing Tourist's Satisfaction based on Service Attributes of Hotels: A Study on Cox's Bazar, Bangladesh 27-54
| Coefficients | |||||
|---|---|---|---|---|---|
| Model | Unstandardized | Standardized | t | Sig. | |
| Coefficients | Coefficients | ||||
| B | Std. Error | Beta | |||
| 1 (Constant) | 2.313 | .038 | 60.606 | .000 | |
| Unavailability of standard of | -.130 | .038 -.126 | -3.395 | .001 | |
| services and facilities of hotels | |||||
| (I1) | |||||
| Behavior and attitudes of | .342 | .038 .332 | 8.957 | .000 | |
| service personnel (I2) | |||||
| Internal and external | .695 | .038 .673 | 18.165 | .000 | |
| environment of hotels (I3) | |||||
| Accommodation facilities (I4) | .108 | .038 .104 | 2.815 | .005 | |
| Unavailable special services | -.058 | .038 -.056 | -1.514 | .131 | |
| according to guests needs (I5) | |||||
| Employees appearance in | .082 | .038 .080 | 2.150 | . | |
| serving food and beverages | |||||
| (I6) | |||||
| Facilities and services from | -.020 | .038 -.019 | -.511 | .610 | |
| hotel to airport (I7) | |||||
| a. Dependent Variable: Tourists Satisfaction | To determine which specific coefficients (β’s) are nonzero, the significance of the partial coefficient for all the variables is tested by t-statistics (Table 6). The partial regression coefficient for the unavailability of standard of services and facilities of hotels (I1) is -.130. The corresponding beta coefficient is -.126. The value t statistics, t= -3.395, with 292 degrees of freedom which is significant at ∞= 0.05. Similarly, the partial regression coefficient for the behavior and attitude of service personnel (I2) is .342 with value of beta coefficient is .332 and value of t statistics is 8.957 which is significant also at ∞= 0.05. The partial regression coefficient for internal and external environment of hotels (I3) is .695 with value of beta coefficient is .673 and the value of t statistics is 18.165 which is also significant at ∞= 0.05. The partial regression coefficient for accommodation facilities (I4) is .108 with value of beta coefficient at .104 and value of t statistics is 2.815 which is also significant at ∞= 0.05. the partial regression coefficient for unavailable special services according to guests needs (I5) is -.058 with value of beta coefficient is -.056 and value of t statistics is -1.514 which is not significant at ∞= 0.05 because (value of significance is .131 partial regression coefficient for employees appearance in serving food and beverages (I6) is .082 with value of beta coefficient is .080 and value of t statistics is 2.150 which is not significant at ∞= 0.05 because (value of significance is 0.32 ∞= 0.05). Finally the partial regression coefficient for facilities and services from hotel to airport (I7) is -.020 with value of beta coefficient is -.019 and value of t statistics is -.511 which is not significant at ∞= 0.05 because (value of significance is .610 unavailable special services according to guests needs (I5), employee’s appearance in serving food and beverages (I6) and facilities and services from hotel to airport (I7) should be kept for further research which helps to explain tourists’ satisfaction based on hotel service attributes in Cox’s Bazar in a more broader perspective. | ∞= 0.05). The ∞= 0.05). Therefore, | |||
To determine which specific coefficients (β’s) are nonzero, the significance of the partial coefficient for all the variables is tested by t-statistics (Table 6). The partial regression coefficient for the unavailability of standard of services and facilities of hotels (I1) is -.130. The corresponding beta coefficient is -.126. The value t statistics, t= -3.395, with 292 degrees of freedom which is significant at ∞= 0.05. Similarly, the partial regression coefficient for the behavior and attitude of service personnel (I2) is .342 with value of beta coefficient is .332 and value of t statistics is 8.957 which is significant also at ∞= 0.05. The partial regression coefficient for internal and external environment of hotels (I3) is .695 with value of beta coefficient is .673 and the value of t statistics is 18.165 which is also significant at ∞= 0.05. The partial regression coefficient for accommodation facilities (I4) is .108 with value of beta coefficient at .104 and value of t statistics is 2.815 which is also significant at ∞= 0.05. the partial regression coefficient for unavailable special services according to guests needs (I5) is -.058 with value of beta coefficient is -.056 and value of t statistics is -1.514 which is not significant at ∞= 0.05 because (value of significance is .131 ∞= 0.05). The partial regression coefficient for employees appearance in serving food and beverages (I6) is .082 with value of beta coefficient is .080 and value of t statistics is 2.150 which is not significant at ∞= 0.05 because (value of significance is 0.32 ∞= 0.05). Finally the partial regression coefficient for facilities and services from hotel to airport (I7) is -.020 with value of beta coefficient is -.019 and value of t statistics is -.511 which is not significant at ∞= 0.05 because (value of significance is .610 ∞= 0.05). Therefore, unavailable special services according to guests needs (I5), employee’s appearance in serving food and beverages (I6) and facilities and services from hotel to airport (I7) should be kept for further research which helps to explain tourists’ satisfaction based on hotel service attributes in Cox’s Bazar in a more broader perspective. 6.3
Frequency Table and Descriptive Statistics
6.3.1Gender
| Frequency | Percent | Valid Percent | Cumulative Percent | |
|---|---|---|---|---|
| Valid | 6 | 2.0 | 2.0 | 2.0 |
| Male | 168 | 54.9 | 54.9 | 56.9 |
| Female | 132 | 43.1 | 43.1 | 100.0 |
| Total | 306 | 100.0 | 100.0 |
Gender

From Table 7 and Figure 3, we can see that among 300 sample size, 168 respondents are male and 132 are
6.3.2Age
Factors Influencing Tourist's Satisfaction based on Service Attributes of Hotels: A Study on Cox's Bazar, Bangladesh 27-54
From Table 7 and Figure 3, we can see that among 300 sample size, 168 respondents are male and 132 are the female.
6.3.2Age
From Table 7 and Figure 3, we can see that among 300 sample size, 168 respondents are male and 132 are the female.
Gender
6.3.2Age
Frequency
demonstrates different age groups of the 300 respondents who actively participated in the study. From the data, it can be seen that 26-35 age group of participants was the highest number and most of the respondents belong to 26, 27, 28, 29, 30, 31and 32 age. Next are respondents between 15-25. Respondents between 36-45 age groups fall into the third position. Rest of the other groups belong to 46-55. On the other hand, the age group 56 and above was the lowest.
6.3.3Education Level
| Frequency | Percent | Valid | Cumulative | |
|---|---|---|---|---|
| Percent | Percent | |||
| Valid Undergraduate | 139 | 45.4 | 46.3 46.3 | |
| Graduate | 161 | 52.6 | 53.7 100.0 | |
| Total | 300 | 98.0 | 100.0 | |
| Missing System | 6 | 2.0 | ||
| Total | 306 | 100.0 | ||
From Table 8, we can see that among 300 sample size, 139 respondents were undergraduate and 161 respondents were graduate.
6.3.4Length of Stay
| Frequency | Percent | Valid | Cumulative | |
|---|---|---|---|---|
| Percent | Percent | |||
| Valid 1 night 2 days | 24 | 7.8 | 8.0 | 8.0 |
| 2nights 3 days | 195 | 63.7 | 65.0 | 73.0 |
| 3 nights and 4 | 81 | 26.5 | 27.0 | 100.0 |
| days | ||||
| Total | 300 | 98.0 | 100.0 | |
| Missing System | 6 | 2.0 | ||
| Total | 306 | 100.0 | ||
From Table 9, we can see that among 300 sample sizes, majority of the respondents stayed 2 nights 3 days is about 63.7% because Cox’s bazar is one of the most comfortable destinations in Bangladesh with lots of amenities and facilities available in hotels. The other group of respondents stayed 3 nights and 4 days is 26.5% because these groups belong to couples, family, friends etc. Another group of respondents stayed 1 night 2 days is about 7.8% only.
6.3.5Frequency of visit
| Frequency | Percent | Valid | Cumulative | |
|---|---|---|---|---|
| Percent | Percent | |||
| Valid 1st time | 104 | 34.0 | 34.7 | 34.7 |
| 2nd times | 166 | 54.2 | 55.3 | 90.0 |
| 3rd times | 19 | 6.2 | 6.3 | 96.3 |
| 4th times | 11 | 3.6 | 3.7 | 100.0 |
| Total | 300 | 98.0 | 100.0 | |
| Missing System | 6 | 2.0 | ||
| Total | 306 From the Table 10, we can see that most of the respondents visiting for the 1st and 2nd times are about 34% and 54.2% respectively. Those who visited for the 3rd and 4th times are majorly in the study tour groups, family and newly married couples as well as those who are engaged in tourism related businesses such as tour operators or travel agents who frequently move with passengers for travelling purposes. | 100.0 | ||
| 54 | Factors Influencing Tourist's Satisfaction based on Service Attributes of Hotels: A Study on Cox's Bazar, Bangladesh 27-54 | 49 | ||
From the Table 10, we can see that most of the respondents visiting for the 1st and 2nd times are about 34% and 54.2% respectively. Those who visited for the 3rd and 4th times are majorly in the study tour groups, family and newly married couples as well as those who are engaged in tourism related businesses such as tour operators or travel agents who frequently move with passengers for travelling purposes.
Factors Influencing Tourist's Satisfaction based on Service Attributes of Hotels: A Study on Cox's Bazar, Bangladesh 27-54
6.3.6Expenditures
| Frequency | Percent | Valid | Cumulative | |
|---|---|---|---|---|
| Percent | Percent | |||
| Valid Below 5000 | 2 | .7 | .7 | .7 |
| 5000-7000 | 196 | 64.1 | 65.3 | 66.0 |
| 7000-10000 | 99 | 32.4 | 33.0 | 99.0 |
| 10000 and | 3 | 1.0 | 1.0 | 100.0 |
| above | ||||
| Total | 300 | 98.0 | 100.0 | |
| Missing System | 6 | 2.0 | ||
| Total | 306 From Table 11, we can see that the expenditures are quite high on visits and stay at Cox’s Bazar and most of the respondents’ expenditures are approximately Tk. 5000 to 7000 and that is 64.1%. But in most of the cases, the expenditure level from 7000 to 10000 is required for stay of more than two days for family, colleagues, newly married | 100.0 | ||
| couples etc. | ||||
From Table 11, we can see that the expenditures are quite high on visits and stay at Cox’s Bazar and most of the respondents’ expenditures are approximately Tk. 5000 to 7000 and that is 64.1%. But in most of the cases, the expenditure level from 7000 to 10000 is required for stay of more than two days for family, colleagues, newly married couples etc. 7.0
Findings
From the frequency table (7, 8, 9, 10, 11) and bar chart (4, 5) we can see that among 300 sample size, 168 respondents are the male and 132 respondents are the female. From the data it can be seen that 26-35 age group of participants was the highest number and most of the respondents were belong to 26,27, 28, 29,30,31and 32 age and after that 15-25 and 36-45 age groups were respectively belong to the second and third in the position. 139 respondents were undergraduate and 161 respondents were graduate among 300 respondents. Majority of the respondents stayed 2nights 3 days is about 63.7% because Cox’s bazar is one of the most comfortable destinations in Bangladesh with a lots amenities and facilities are available in hotels. Another group of respondents stayed 3 nights and 4 days is 26.5% because these groups belong to couples, family, friends etc. and another group of respondents stayed 1 night 2 days is about 7.8% only. Most of the respondents visited 1st time and 2nd times is about 34% and 54.2% respectively. Most of the respondents’ expenditures become approximately Tk. 5000 to 7000 and that is 64.1.
From factor analysis, we can see that, the null hypothesis which states that the twenty-nine (29) variables are uncorrelated is rejected by the Barlett’s test of sphericity (Table 1). It was found that the approximate chi-square statistics is 7662.599 with 406 degrees of freedom which is significant at .05 levels.
Besides, high values (between .5 and 1.0) of KMO measure of sampling adequacy indicate that the factor analysis is appropriate. Here, as the value of the KMO statistic (Table 1) is .778. The Eigen value for a factor analysis, Factor 1 account for a variance of 8.022, which is (8.022/29) or 27.662% of the total variance. Likewise, the next six factors (4.232/29), (3.254/29), (2.133/29), (1.640/29), (1.292/29) and (1.168/29) account for 14.594%, 11.221%, 7.357%, 5.655%, 4.456% and 4.028% of the total variance respectively. Here the first seven (7) factors combined account for 74.971% of the total variance (Table 2). The factors extracted should account for at least 60% of the variance and here, the first seven (7) factors account for 74.971% of the total variable is shown in Scree Plot (Table 2, Figure 2). In Rotated Component Matrix (Table 3), 29 variables are labeled in 7 factors : Unavailability of standard of services and facilities of hotels (I1), Behavior and attitudes of service personnel (I2), Internal and external environment of hotels (I3), Accommodation facilities (I4), Unavailable special services according to guests needs (I5), Employees appearance in serving food and beverages (I6), Facilities and services from hotel to airport (I7) for conducting Correlation (Table 4) and Regression Analysis. 3.
The results of multiple regression coefficient unfolded the nature of relation and the effect of these aforementioned factors of service attributes of hotels such as unavailability of standard of services and facilities of hotels, behavior and attitudes of service personnel, internal and external environment of hotels, accommodation facilities, unavailable special services according to guests needs, employee’s appearance in serving food and beverages, facilities and services from hotel to airport have a strong impact on tourists satisfaction. From Significance of the Partial Coefficients, Table6 shows that if f standard of services and facilities of hotels are not available for the tourists in Cox’s Bazar, they will not be satisfied. The result of partial regression coefficient for the unavailability of standard of services and facilities of hotels (I1) is -.130. The corresponding beta coefficient is -.126. The value t statistics, t= -3.395, with 292 degrees of freedom which is significant at ∞= 0.05. Therefore, hotel managers should take effective mechanisms and strategy to make services available according to tourists needs such as quality food and beverage service, prompt safety and security, cleanliness of environment, available bill payment procedures (cash, debit card, credit or master/visa card, Bkash, Upay, dbbl mobile banking), arrangements of nightlife for tourists enjoyment, responsiveness of tourists complaints, promptness of response in case of emergency service (medicine, hospital, fire), swimming pool, beauty parlor, gymnasium, spa facilities according to tourists demand, standard reservation systems, knowledgeable employees in case of guests information. In the second factor, if behavior and attitudes of service personnel are good enough, tourists satisfaction will automatically increase and the service attributes are marked by (cleanliness of environment, helpful attitude of employees towards tourists, employees level of proficiency in English to handle foreign
Factors Influencing Tourist's Satisfaction based on Service Attributes of Hotels: A Study on Cox's Bazar, Bangladesh 27-54 tourists, skillful employees in handling guests query, special facilities for children ( swimming pool, baby sitter, cradle), hotel escorting services (outdoor attractions, museum, other destinations), reasonable service costs). the partial regression coefficient for the behavior and attitudes of service personnel (I2) is .342 with value of beta coefficient is .332 and value of t statistics is 8.957 which is significant also at ∞= 0.05. in case of internal and external environment of hotels, accommodation facilities and employee’s appearance in serving food and beverages, as these factors are available in hotels and shows positive relation (Table 6), so tourists satisfaction will increase. The partial regression coefficient for internal and external environment of hotels (I3) is .695 with value of beta coefficient is .673 and value of t statistics is 18.165 which is also significant at ∞= 0.05. The partial regression coefficient for accommodation facilities (I4) is .108 with value of beta coefficient is .104 and value of t statistics is 2.815 which is also significant at ∞= 0.05. Here I5, I6 and I7 variables are not significant at ∞= 0.05. Therefore, unavailable special services according to guests needs (I5), employee’s appearance in serving food and beverages (I6) and facilities and services from hotel to airport (I7) should be kept for further research which may help to explain tourists’ satisfaction based on hotel service attributes in Cox’s Bazar in a broader perspective.
8.0Recommendations
Tourism stakeholders and hotel managers should take some efficient and effective strategies to make attractive services to grab both domestic and foreign tourists to come and visit Cox’s Bazar. Local communities are important in the tourism development process as well as better quality of hotel services because all the tourist activities take place within their premises. Although there are many ways to involve local communities, tourism decision making process is one of the most appropriate ways of involving the local community in tourism development. So local people can be trained on Community based tourism (CBT). The can be employed in various hotels as front desk managers, reservation agents, door keepers, housekeeper, laundry attendants, escorting guide, tourists police for ensuring safety and security for the tourists etc. Government and private stakeholders should plan, develop and implement tourism and hotels related activities and provide facilities for ensuring tourists satisfaction. In this study IV I5, I6 and I7 variables are not significant at ∞= 0.05. Therefore, unavailable special services according to guests needs (I5), employee’s appearance in serving food and beverages (I6) and facilities and services from hotel to airport (I7) should be kept for further research which to explain tourists’ satisfaction based on hotel service attributes in Cox’s Bazar in a broader perspective.
9.0Conclusion
The purpose of this paper is to investigate hotel service attributes that affect tourists’ satisfaction in Cox’s Bazar. A conceptual model of tourists’ satisfaction on hotel service attributes in Cox’s Bazar was proposed in this study based on factor and regression analysis. In conclusion, if properly designed, administered and analyzed, hotel service attributes in Cox’s Bazar that affect tourist’s satisfaction can be beneficial to any hospitality enterprise. As we can see, unavailability of special services, employee’s appearance and various levels of facilities and services are not up to the mark according to tourists’ demand. So further research should be made based on these variables. At the same time, stakeholders of hotels in Cox’s Bazar should create more facilities and attractive services for both its domestic and foreign tourists. Maintaining overall service quality should be the prime concern for every hotelier. Overall, hotel service attributes should be increased such as standard accommodation facilities, quality of food and beverage, service attributes, prompt safety and security, cleanliness of environment, bill payment procedures (cash, debit card, credit or master/visa card, Bkash, Upay, dbbl mobile banking), timely response to guests’ needs, special service attributes and facilities (Wi-Fi, audio visual, projector room for business seminar, machine, pasty/ cake for birthday/anniversary celebration), available parking facilities, arrangements of nightlife for tourists enjoyment, responsiveness of tourists complaints, prompt response in case of emergency service (medicine, hospital, fire), swimming pool, gymnasium, spa facilities according to tourists demand, standard reservation systems, knowledgeable employees in case of guests information etc. are needed to grab both domestic and foreign tourists attention. By providing the aforementioned service attributes, we can ensure a lots of foreign tourists’ arrivals as well as satisfaction and loyalty by providing best quality of hotel services that will help to earn foreign exchange for the country. Local people at Cox’s Bazar will also benefit in terms of employment opportunities and standard of living will improve through generation of income. At the same time, poverty will also reduce significantly.
References
- Ananth M., DeMicco F. J., Moreo P. J., & Howey R. M. (1992). Marketplace lodging needs of mature travelers. The Cornell Hotel and Restaurant Administration Quarterly, 33(4), 12–24.
- Atkinson A. (1988). Answering the eternal question: what does the tourists want?. The Cornell Hotel and Restaurant Administration Quarterly, 29(2), 12–14.
- Atilgan, E., Akinci, S., & Aksoy, S. (2003). Mapping service quality in the tourism industry. Managing Service Quality, 13(5), 412–422.
- Barsky J. & Labagh R. (1992). A strategy for tourists’ satisfaction. The Cornell Hotel and Restaurant Administration Quarterly, 35(3), 32–40.
- Barsky J., & Nash L. (2003). Tourists satisfaction: Applying concepts to industry-wide measures. The Cornell Hotel and Restaurant Administration Quarterly, 44(4), 173-183.
- Barsky, J., & Nash L. (2006). Companies update loyalty programs, increase effectiveness. Hotel & Motel Management, 22(11), 28-29.
- Berkman H. W. & Gilson C. (1986). Consumer Behavior: Concepts and Strategies, 3rd ed., Kent, Boston.
- Blanchard R. F., & Galloway R. L. (1994). Quality in retail banking. International Journal of Service Industry Management, 5(4), 5–23.
- Cadotte E. R. & Turgeon N. (1988). Key factors in guest satisfaction. The Cornell Hotel and Restaurant Administration Quarterly, 45–51.
- Camisón, C. (1996). Total quality management in hospitality: An application of the EFQM Model. Tourism Management, 17(3), 191–201.
- Choi T. Y., & Chu R. (2001). Determinants of hotel guests’ satisfaction and repeat patronage in Hong Kong hotel industry. International Journal of Hospitality Management, 20, 277-297.
- Choi, Y. T., & Chu, R. (2000). Levels of satisfaction among Asian and Western travelers. International Journal of Quality & Reliability Management, 17(2), 116–131.
- Churchill, G. A., & Suprenant, C. (1982). An investigation into determinants of tourists satisfaction. Journal of Marketing Research, 19, 491-504.
- Davidson, M. C. G. (2003). Does organizational climate add to service quality in hotels? International Journal of Contemporary Hospitality Management, 15(4), 206–213.
- Dominici G. (2009). E-Marketing. Analisi dei cambiamenti dai modelli di business al mix operativo, Franco Angeli, Milan.
- Fyall A., Callod C., & Edwards B. (2003). Relationship Marketing: The Challenge for Destinations. Annals of Tourism, 30(3), 644-659.
- Fornell C. (1992). A national tourist’s satisfaction barometer: The Swedish experience. Journal of Marketing, 56, 6–21.
- Gagliano, K. B., & Hathcote, J. (1994). Tourist’s expectations and perceptions of service quality in retail apparel specialty stores. Journal of Service Marketing, 8(1), 60–69.
- Galloway, L. (1998). Quality perceptions of internal and external tourists: A case study in educational administration. The TQM Magazine, 10(1), 20–26.
- Getty, J. M., & Getty, R. L. (2003). Lodging Quality Index (LQI): Assessing hotel guests’ perceptions of quality delivery. International Journal of Contemporary Hospitality Management, 15(2), 94–104.
- Gronoos, C. (1990). Service management and marketing: Managing the moments of truth in service competition. Lexington Books, USA.
- Gruen T. W., Summers J. O., & Acito, F. (2000). Relationship marketing activities, commitment, and membership behaviors in professional associations. Journal of Marketing, 64(3), 34-49.
- Gundersen, M. G., Heide, M., & Olsson, U. H. (1996). Hotel guest satisfaction among business travelers: What are the important factors? Cornell Hotel and Restaurant Administration Quarterly, 37(2), 72–81.
- Gupta, A., & Chen, I. (1995). Service quality: Implications for management development. International Journal of Quality & Reliability Management, 12(7), 28–35.
- Halstead D., & Page Jr. T. J. (1992). The effects of satisfaction and complaining behavior on consumers repurchase behavior. Journal of Satisfaction, Dissatisfaction and Complaining Behavior, 5, 1–11.
- Hayes B. E. (2008). Measuring Tourists Satisfaction and Loyalty, 3rd edition, ASQ Quality Press, Milwaukee, USA.
- Hwang, L. J. J., Eves, A., & Desombre, T. (2003). Gap analysis of patient meal service perceptions. International Journal of Health Care Quality Assurance, 16(3), 143–153.
- Ingram, H. (1999). Hospitality: A framework for a millennial review. International Journal of Contemporary Hospitality Management, 11(4), 140–147.
- Johns, N., & Howard, A. (1998). Tourist’s expectations versus perceptions of service performance in the foodservice industry. International Journal of Service Industry Management, 9(3), 248–265.
- Jones D. L., Mak B., & Sim J. (2007). A New Look at the Antecedents and Consequences of Relationship Quality in the Hotel Service Environment. Service Attributes Marketing Quarterly, 28(3), 15-31.
- Kandampully J. & Suhartanto D. (2000). Tourist’s loyalty in the hotel industry: The role of tourist’s satisfaction and image. International Journal of Contemporary Hospitality Management, 12(6), 346-351.
- Mellens, Michael, Marnik G. Dekimpe and Jan-Benedict E. B. Steenkamp (1996), “A Review of Brand-Loyalty Measures in Marketing”, Tijdschrift voor Economie en Management, 41(4), 507-533.
- Pizam, A., & Ellis, T. (1999). Tourist’s satisfaction and its measurement in hospitality enterprises. International Journal of Contemporary Hospitality Management, 11(7), 326–339.
- Poon, W. C., & Low, K. L. T. (2005). Are travelers satisfied with Malaysian hotels? International Journal of Contemporary Hospitality Management, 17(3), 217–227.
- Reinartz, Werner J. and V. Kumar (2002), “The Mismanagement of Customer Loyalty”, Harvard Business Review, July, 86-94.
- Reisinger, Y., & Turner, L. (1999). A cultural analysis of Japanese tourists: Challenges for tourism marketers. European Journal of Marketing, 33(11/12), 1203–1227.
- Sekaran, U. (2003). Research methods for business: A skill building approaches (4th ed.). New York: John Wiley.
- Tsang, N., & Qu, H. L. (2000). Service quality in China’s hotel industry: A perspective from tourists and hotel managers. International Journal of Contemporary Hospitality Management, 12(5), 316–326.
- Zahra, L (2012). Destination image and tourism: a case study of Bangladesh. European Journal of Business and Management (Online). Available from: http://iiste.org/ journals/index.php/EJBM/article/view/1574 ( Access: 12/05/2016).
- Zeithaml, V. A., & Bitner, M. J. (2003). Service marketing: Integrating tourists focus across the firm. New York: McGraw-Hill.
- Zikmund, W. G. (2000). Business research methods (6th ed.). Fort Worth, TX: The Dryden Press.