Regional Expansion Policy in the Northern Sumatra Province of Indonesia: Impact on Regional Inequality
- Faculty of Economics and Management, Universiti Kebangsaan Malaysia, Bangi, Selangor
Journal of Business Management and Accounting 9(2) (2019) · https://doi.org/10.32890/jbma2019.9.2.8725
Abstract
This study aims to examine the impact of regional expansion policy on regional development inequality in North Sumatra province, Indonesia. North Sumatra province is one of 34 Provinces in Indonesia. This province produce many new regencies and cities as a result of regional expansion policy. In 2000, the number of regencies in North Sumatra Province were 19 and then expanded to 33 in 2009. The number of regencies remain unchanged since then. The aim of regional expansion policy is to improve prosperity and accelerate development. Therefore, this study attempts to analyze whether the policy of regional expansion in North Sumatra Province achieved the purpose or rather caused development inequality in the regency. This study utilized the Williamson Index method to analyze the value of development inequalities in North Sumatra Province from 2000 to 2016 using data from all regencies in the province. The results show that the expansion of the regency has resulted in a high level of development inequality. This indicates that developmental inequality is increasing.
Keywords: Development inequality, regional expansion policy, Williamson Index, government policy, economics
1.0Introduction
Development is an effort aimed at enhancing the standard of living of society which includes various changes in social attitudes, social structures, economic structures, income per capita. Eventually, it is expected to achieve equal income distribution for the people of a country as well as poverty alleviation to achieve sustainable economic growth. In order to achieve the goal, implementation of the right government policy is important. Indonesia has been implementing a regional expansion policy with the aim of providing opportunities for each regency to expand its potential to support their development. At the end, it is expected to have positive impact on the increase of
E-email: laiws@ukm.edu.my central revenue. The implementation of this policy is done by identifying regencies that are capable of developing and growing independently. These regencies are then made regencies with self-development. Regional expansion can create efficiency, effectiveness, and sense of responsibility for the regency government in providing services to the community (Bismar et al, 2013).
Indonesia is known as a country with abundant natural resources with a total area of 5,193,250 km². The country is the world’s largest archipelago with 17,504 islands and a population of 257,912,349 (BPS, 2017). However, the diversity of Indonesia’s natural resources spread across the region does not make it a developed country. In fact, the country is a lower middle income country and faces problem of regional inequality among her 541 regencies. Regional inequality is defined as the uneven distribution of income or other variables such as social wellbeing of people living in different geographical areas or regions within the country (Raheem et al. 2014). The geographical variation in the distribution of resources and by extension the non uniformity of governmental policies as applied to different areas causes disparity. The existence of development inequality between regions in Indonesia can be seen from the economic census data in 2010. There are 199 less developed regencies or 43 percent of the total regencies in Indonesia. Besides, there are 27 regencies which are border regencies such as the West Kalimantan border which is rich with natural resources and have access to the Sarawak market. In reality the country is composed of around 45 percent poor villages involving 35 percent of total population (Dewan Perwakilan Daerah Republik Indonesia, 2013).
The economic structure of Indonesia is dominated by activities carried out in Java Island and Sumatra Island. Pulau Jawa is the largest contributor to Indonesia’s GDP of 58.65 percent followed by Sumatra Island with 21.69 percent and Kalimantan Island with 8.15 percent (BPS, 2017). Development inequality between regions is a phenomenon that often exists within a country. This inequality is essentially due to the difference in the wealth of existing resources owned by each regency as well as the differences in the geographical location of each region. As a result of these differences, the ability of a regency to generate growth and economic development also varies (Sjafrizal, 2012). The establishment of new regencies through regional development process has occurred since the inception of the establishment of the Republic of Indonesia but in very limited numbers (Korpus, 2017). Based on government regulation of the Republic of Indonesia No. 78, 2007 on the procedures for the establishment, elimination, consolidation and development of regency, the expansion of a regency covering the division between two or more regencies into one regency will enable the regency to have the power to manage and determine the process of developing the regency. Regional expansion can be interpreted as the establishment of a new administrative regency that aims to achieve the goal of improving the quality of public services and accelerate society’s well-being.
North Sumatra Province is one of the provinces that has created many new regencies as a result of regional expansion. The last expansion of the regency was in 2009 by adding three new regencies. Until year 2017, the total number of regencies in North Sumatra Province is as much as 33 (Khairul et al, 2010). The conditions for the establishment of new regencies are based on the economic capability, the potential of natural resources, the area of regency, the defense, security, social culture, politics, level of well-being of society and the population. In order to evaluate the development of new regencies, it is necessary to compare the performance of the regency before and after the expansion of the regency. It is important to see the growth that occurs between before and after as it shows changes that lead to significant progress or even a setback. Hence, this study aims to see whether the government’s policy on regional expansion is an appropriate step in reducing regional development inequalities.
The objective of this paper is to examine the impact of regional expansion policy on regional inequality in North Sumatra, Indonesia. In the next section, the study reviews previous studies. The subsequent section describes the data and methodology of the study. Furthermore, the results of the study were explained in the results section. Finally, the study’s conclusions, discussion and implications were presented.
2.0Literature Review
Regional inequality within a country has been a worldwide issue. Many measures have been used in the study of regional inequality. Williamson Index is a powerful measurement as it can measure inequality in historical period. Francisco and Julio (2015) applied Williamson Index to measure inequality at the provincial level in Spain between 1860 and 1930. Their empirical results confirm the presence of a Kuznets’ curve. Besides, coefficient of variation and Hoover concentration index are other measures. However, opposite results are often obtained from different quantitative measures (Huang and Leung, 2009). Huang and Leung applied coefficient of variation and Hoover concentration index to measure inequality in Jiangsu province in China. Their results confirm that different trends are exhibited by the two measures for the same data set. Thus employment of indices to measure inequality should be done cautiously as it may lead to invalid conclusion. Carlos (2001) applied Theil’s inequality index to analyse regional inequality in Brazil in the period of 1939 – 1995. Results indicate the presence of important oscillations in the evolution of inequality over time as well as across regions within the country.
The main goal of Economic development is creating a fair and equitable social welfare throughout Indonesia. Results of the study conducted by Ari Mulianta Ginting (2014), using the Williamson Index method shows that development inequalities exist in eastern and western Indonesia and the magnitude of the Williamson Index values differ. In
2014, the Williamson Index for Eastern Indonesia was 0.42585 while West Indonesia regency was 0.239. This suggests that development inequality in East Indonesia is larger than the Western region. However, in 2012, the Williamson index for Eastern Indonesia fell steadily to 0.21929. This indicates that there has been an improvement in the quality of development especially in Eastern Indonesia. Development inequality between regions is a common economic phenomenon that exist in regencies. This inequality is basically the result of the differences in the wealth of existing resources owned by each region, the geographical location differences in each regency, the total regency within a province and the current economic situation. As a result of these differences, the ability of a regency to generate growth and economic development also varies (Sjafrizal, 2012). Based on the results of the study conducted in Central Java Province in Banyumas Regency by Kuncoro (2014), development inequality occurred in Banyumas Regency from 1993 to 2000. There was an increase in Williamson Index value of 0.35 in 1993 to 0.47 in that year. However, there was a drop in Williamson Index value from 0.44 in 1997 to 0.43 in 1998. The value then rose in the following year to 0.47. The cause of inequalities was the financial crisis that occurred in Indonesia which has an impact on Banyumas Regency’s economy. Urban regencies suffered greater losses compared to rural regencies causing inequality to decline in 1998.
Another recent study in Indonesia by Hendry et al. (2017) which analysed the potential sectors and inequality in Gerbangkertosusila East Java province, attributable to the observation of programs and government policies promoting economic development in the province of East Java for period of 2009 – 2011. Income inequality which was measured by Williamson Index in the study report an average value of 0.22. With the highest value in Surabaya city (0.52) and the lowest in Gresik District (0.06), suggesting that necessary economic policy which focuses on developing the economic potential of each region is crucial. Development inequalities can occur as a result of an increase in population which is not followed by an increase in income. According to a study by Maya Panorama (2013) on South Sumatra province using the Williamson Index, the value of the Williamson Index in the regency is declining every year but the magnitude fluctuates. The index value decreased from 0.41 in 1991 to 0.37 in 1997. Then in 1998, the magnitude of this index increased highly to 0.60 indicating a lot of inequality. According to the findings of the study, this situation occurred because of the high population growth but not followed by the increase of per capita income. Sri Rosliana Lubis (2018) analyzed the effect of GDP, population, development expenditure and unemployment rate on the imbalance of economic development between cities in North Sumatra using panel data analysis. It was found that the number of influential population and development expenditure has a positive and significant effect on the disparity of economic development. Based on the previous study, it is known that there are various conditions that can cause development inequalities and there are limited studies focusing on the impact of regional expansion on regional inequality in North Sumatra. North Sumatra province is known to have regional expansion where the lowest in Gresik District (0.06), suggesting that necessary economic policy which focuses on developing the economic potential of each region is crucial. Development inequalities can occur as a result of an increase in population which is not followed by an increase in income. According to a study by Maya Panorama (2013) on South Sumatra province using the Williamson Index, the value of the Williamson Index in the regency is declining every year but the magnitude fluctuates. The index value decreased from 0.41 in 1991 to 0.37 in 1997. Then in 1998,Expansion Regional the magnitude of thisSumatra Policy in the Northern indexProvince increased highly of Indonesia: toon0.60 Impact indicating Regional a lot of inequality. Inequality: 93-103 97 According to the findings of the study, this situation occurred because of the high population growth but not followed by the increase of per capita income. Sri Rosliana Lubis (2018) analyzedofthe increase effect ofcontinued regency GDP, population, development until 2009. Therefore, expenditure and unemployment in this study, we are trying ratetoonsee the imbalance of economic development between cities in North Sumatra using panel data analysis. whether the policy of regional expansion in North Sumatra Province causes the level of It was found that the number of influential population and development expenditure has a positive and development inequality significant effect to increase on the disparity or decrease. of economic development. Based on the previous study, it is known that there are various conditions that can cause development inequalities and there are limited studies focusing on the impact of regional expansion on regional inequality in North Sumatra. 3.0NorthData Sumatra andprovince Methodology is known to have regional expansion where the increase of regency continued until 2009. Therefore, in this study, we are trying to see whether the policy of regional expansion in North Sumatra Province causes the level of development inequality to increase or This study uses quantitative research method and utilized secondary data to answer the decrease. research qustions. Quantitative research is a research that requires the use of numbers, data 3.0 collection, data interpretation, and the presentation of the results. At the end of Data and Methodology the study, it will be better if accompanied by pictures, tables, graphics, or other views This 2013). (Afid, study uses quantitative Secondary dataresearch method and were obtained fromutilized secondary the Central data to Agency Statistics answer the research (BPS) of qustions. Quantitative research is a research that requires the use of numbers, data collection, North Sumatra Province, the Central Statistics Agency of Indonesia, official documents data interpretation, and the presentation of the results. At the end of the study, it will be better if issued by the North accompanied Sumatra by pictures, provincial tables, graphics,government and(Afid, or other views the acts pertaining 2013). to the Secondary study data were needs. Thefrom obtained datathe used are from Central 2000Agency Statistics to 2016 (8 years (BPS) of study) of North SumatraandProvince, includesthedata on Central StatisticsofAgency incomes of Indonesia, the regency, official documents the population, issued by the overall contribution North of the Sumatra sector economic provincial to government and the acts pertaining to the study needs. The data used the Provincial GDP. Micrsoft Excel 2016 was utilized in calculating the index. are from 2000 to 2016 (8 years of study) and includes data on incomes of the regency, the population, overall contribution of the economic sector to the Provincial GDP. Micrsoft Excel 2016 was utilized in calculating Williamson the index. Index is named after Economist Williamson (1965) who was the first person to find out how to measure the magnitude of inequality between regions Williamson within Index ispopulation. a country’s named after This Economist studyWilliamson applied the (1965) who was the measurement first person method to find proposed out how to measure the magnitude of inequality between regions within a country's by Williamson (1965). Williamson Index method is presented in the form of a basic population. This study applied the measurement method proposed by Williamson (1965). Williamson Index formula, as follows: method is presented in the form of a basic formula, as follows:
√∑𝑚𝑚 𝑖𝑖=1(𝑦𝑦𝑖𝑖 − 𝑦𝑦 ̅(𝑤𝑤) )² / 𝑛𝑛𝑖𝑖 𝐶𝐶𝐶𝐶𝑤𝑤 = (1) (1) 𝑦𝑦̅(𝑤𝑤) Where CV is coefficient of variation; 𝑦𝑦𝑖𝑖 is income per capita for regency i (i = 1, …, m); 𝑛𝑛𝑖𝑖 is Where CV is𝑛𝑛𝑖𝑖coefficient population, = 𝑁𝑁𝑖𝑖 /𝑁𝑁 (N of isvariation; nation’s population), is incomewhich means regency’s per capita for regencypopulation divided i (i = 1, …, by nation’s population (region’s weight); 𝑦𝑦̅ is average regency’s income per capita regency, m); ni is population, ni = Ni /N (N is nation’s population), which means regency’s population divided by nation’s population (region’s weight); y is average regency’s income per capita regency, y = (yi + ... + ym)/ m, and y(w) where y(w) = n1m1 + ... + nmym 𝑦𝑦̅ = (𝑦𝑦𝑖𝑖is+nation’s which ⋯ + 𝑦𝑦𝑚𝑚 )/𝑚𝑚, and 𝑦𝑦 average ̅(𝑤𝑤) where income per 𝑦𝑦̅capita. 𝑛𝑛1 𝑚𝑚1 +the…formula (𝑤𝑤) = Next, + 𝑛𝑛𝑚𝑚 𝑦𝑦of 𝑚𝑚 which is nation’s Williamson Index is average income per capita. Next, the formula of Williamson Index is written as follow written as follow (Gluschenko, 2015). (Gluschenko, 2015).
√∑𝑁𝑁 ̅ )² / 𝑁𝑁 𝑖𝑖=1(𝑦𝑦𝑖𝑖 − 𝑦𝑦 IW = (2) (2) 𝑦𝑦̅ where, Iw = Williamson Index where, Iw = inequality Williamson's WilliamsonindexIndex will produce magnitude greater than or equal to zero. If 𝑦𝑦𝑖𝑖 = 𝑦𝑦̅, then this condition will find the value of the Williamson Index quantity of 0 (zero) and indicate the economic inequality Williamson’s between inequality the will index regions does notmagnitude produce exist. Greatergreater Williamson thanIndex than zero or equal to zero. indicates economic inequalities between regions. Greater value of the Williamson Index in an Ifareayi =indicates y, then this that the economic inequality between regions is higher. The size of the of 0 condition will find the value of the Williamson Index quantity measurement in determining economic inequalities between the regions according to the Williamson Index is the Williamson Index is a value of 0 to 1, When the Williamson Index value: 𝑰𝑰𝒘𝒘 = 0 indicates low development inequality 𝑰𝑰𝒘𝒘 ≤ 0.3 indicates low development inequality
(zero) and indicate the economic inequality between the regions does not exist. Greater Williamson Index than zero indicates economic inequalities between regions. Greater value of the Williamson Index in an area indicates that the economic inequality between regions is higher. The size of the measurement in determining economic inequalities between the regions according to the Williamson Index is the Williamson Index is a value of 0 to 1,
When the Williamson Index value: 𝑰𝒘 = 0 indicates low development inequality 𝑰𝒘 ≤ 0.3 indicates low development inequality 𝑰𝒘 = 0.3 – 0.5 indicates moderate development inequality 𝑰𝒘 = 0.5 – 1 indicates high development inequality
This shows that as the value of Willliamson Index increases, development inequality is higher. Inversely, smaller value of Williamson Index indicates development inequality is getting better. (Mudrajat Kuncoro, 2014).
4.0Result and Discussion
The Williamson Index yield the value of inequality (Iw) for the entire region in North Sumatra Province in 2000-2016. The change in the number of regencies in North Sumatra Province from year 2000 is as follow: 19 regencies from 2000 to 2002; 23 regencies in 2003; 25 regencies from 2004 to 2006; 26 regencies in 2007; 28 regencies in 2008 and 33 regencies since 2009 until now. Table 1 reported the value of Williamson index.
| Year | Williamson Index |
|---|---|
| 2000 | 0.295 |
| 2001 | 0.306 |
| 2002 | 0.435 |
| 2003 | 0.472 |
| 2004 | 0.477 |
| 2005 | 0.503 |
| 2006 | 0.521 |
| 2007 | 0.549 |
| 2008 | 0.582 |
| 2009 | 0.614 |
| 0.7 | |
| 2008 | 0.582 |
| 0.6 2009 | 0.614 |
| 0.5 | |
| 0.4 | |
| 0.3 | |
| 0.2 | |
| 0.1 | |
| 2000 2001 2002 | 2003 2004 2005 2006 2007 2008 |
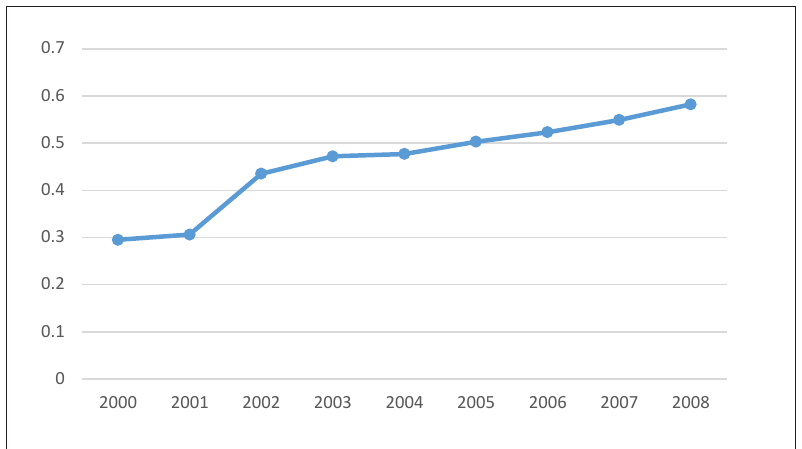
Based on Table 1.0, the increasing Williamson Index value indicates an increasingly significant inequality every year. In the early years of the study, there were 19 regencies. With the smaller number of regencies in North Sumatra rrovince, the value of inequality is 0.295 (Iw ≤ 0.3 indicates a low level of inequality). Furthermore, the increase in value of inequality continues to occur along with the increase in the population and the number of regencies each year. In 2001 and 2002 there was no increase in the number of regencies but there was an increase in the population from 11.6 million to 12.6 million. With the increase in the population, the value of the Williamson Index has risen and reached 0.306 and 0.435 which have entered a moderate scale of inequality Figure (Iw = 0.3 1: Williamson - 0.5 Indexinequality). indicates simple (2000 – 2008)Subsequently, there was addition of 3 new regencies and 1 city in 2003 and two new regencies in 2004. The expansion of the Based that regency on Table 1.0, the increasing is in conjunction Williamson with the increase in theIndex valueled population indicates the valueanofincreasingly the sig Williamson Index to increase from 0.472 in 2003 to 0.477 in 2004. In 2005 to 2006, inequality every year. In the early years of the study, there were 19 regencies. With the the expansion number of ofthe regency was regencies not significant in North Sumatraandrrovince, the numbertheremained value ofin 25 regenciesis 0.295 (I inequality and indicates a low level of inequality). Furthermore, the increase in valuevalue cities corresponding to the increase in population. This situation led to the of of inequality con the Williamson Index increasing to 0.503 in 2005 and 0.521 in 2006. The value occur along with the increase in the population and the number of regencies each year. of the Williamson and 2002 Indexthereindicates was noaincrease very highindevelopment the number inequality (Iw = 0.5 of regencies but- 1there indicating was an increas extremely high inequality). population from 11.6 million to 12.6 million. With the increase in the population, the val Williamson Index has risen and reached 0.306 and 0.435 which have entered a moderate Regency development inequality (Iw = 0.3was resumed - 0.5 in 2007 indicates and 2008. simple In 2007,Subsequently, inequality). there were 26 regencies there was addition and cities in 2007, causing the Williamson Index to increase to a value regencies and 1 city in 2003 and two new regencies in 2004. The expansionof 0.549. This of the regenc shows a greater inequality. Regency development continued until 2008 where the in conjunction with the increase in the population led the value of the Williamson number of regencies/cities increased to 28. The Williamson Index reached a high value increase from 0.472 in 2003 to 0.477 in 2004. In 2005 to 2006, the expansion of the rege not significant and the number remained in 25 regencies and cities corresponding to the in population. This situation led to the value of the Williamson Index increasing to 0.503 and 0.521 in 2006. The value of the Williamson Index indicates a very high deve inequality (Iw = 0.5 - 1 indicating extremely high inequality).
of 0.582 which indicate high inequality. The last development of the regency was carried out in 2009 when the number of regencies/cities increased to 33 and the value of the Williamson Index also increased. The Williamson Index value reached a very high value of 0.614. The value of Williamson Index keep increasing after 2009 even though regency development had stopped. Table 2 shows the values of Williamson Index from 2010 to 2016.
| inequality. Regency development continued until 2008 where the number of regencies/c | ||
|---|---|---|
| increased to 28. | ||
| YearThe Williamson Index reached | a highIndex | |
| Williamson | value of 0.582 which indicate | |
| inequality. The | last | |
| 2010 development | of the regency was carried 0.625 out in 2009 when the numbe regencies/cities increased to 33 and the value of the Williamson Index also increased. | |
| 2011 value reached a very high value of 0.639 | ||
| Williamson Index | 0.614. The value of Williamson Index | |
| increasing after 2009 even though regency development | ||
| 2012 | 0.553had stopped. Table 2 shows the va | |
| of Williamson2013 | ||
| Index from 2010 to 2016. | 0.547 | |
| 2014 | 0.552 | |
| Williamson Index, | ||
|---|---|---|
| 2016 2009 to 2016 Year 2010 | 0.561 Williamson Index 0.625 | |
| 0.66 | 2011 | 0.639 |
| 0.64 | 2012 | 0.553 |
| 0.62 | 2013 | 0.547 |
| 0.6 | 2014 | 0.552 |
| 0.58 | 2015 | 0.555 |
| 0.56 | 2016 | 0.561 |
| 0.54 | ||
| 0.52 | ||
| 0.5 | 2009 2010 2011 | 2012 2013 2014 2015 2016 |

Table 2 shows that in 2009 to 2011 the value of Williamson Index is very high: 0.614; 0.625 and 0.639. This value is the highest value within 2012 to 2016. Williamson Index values drop in 2012 and has been increasing since 2013. This situation is due to the increase in per capita GDP of North Sumatra Province which started to increase from 28.9 thousand to 33.2 thousand in 2016. Although the value of the Williamson Index in 2012 to 2016 is still considered as perfect inequality, the magnitude of Iw is smaller than the value in the year 2009 to 2011. In 2012, there was a decline in Iw value of 0.086 (0.553). In 2013 the Williamson Index value again decreased by 0.006 (0.547). Meanwhile, in 2014, 2015 and 2016, the increase of the Iw values were 0.552, 0.555 and 0.561. These values are still in the range of of perfect inequality.
Based on the change of the Williamson Index values in 8 years of study, it can be seen that the province that remained with a total of 33 regencies/cities has a better situation. Despite the fact that development inequalities from 2009 to 2016 remain in the regency, but over time, the value of developmental inequality is diminishing. It appears that the value initially showed a very high value over 0.6 then over time decreased until the end of the year when the value of development inequality decreased to 0.5. In conclusion, the magnitude of development inequality in North Sumatra Province shows that the implementation of government policy on regional expansion can refined to make good impact on the local community. Expansion of the regency can be done but must be based on justice for every regency in North Sumatra Province. Income distribution should be carried out in full, be conducted transparently and the amount of budget allocated must be appropriate to the needs of the regencies. Hence, even though the regency is wider and the population is increasing, with fair treatment from the central government to the local governments and adequate budget, the region can begin to achieve sustainable development.
In the process of achieving sustainable development, the role of society is very important and the government is capable of improving the welfare of the community so as to reduce and even eliminate the inequality between regions. Therefore, every society can witness the same development as the developed regions. Although the value of the Williamson Index indicates that North Sumatra Province is a region of high inequality, as time goes on, it continues to experience improvement. This means that there has been a remedial effort which is expected to yield good result in the years to come (after 2018). The Williamson Index value for the North Sumatra Province continues to show a significant decline.
5.0Conclusion
This study examine the impact of regional expansion on regional development inequality using Williamson Index. The results of the study suggest that expansion of regencies that is taking place for the purpose of prospering the society’s economy in Sumatra province Indonesia is yet to have a positive impact. With the addition of the regency that took place until 2009, the value of development inequality is high and increasing. When looking at the value of development inequality after regency expansion stopped in 2009, the magnitude of inequality was decreasing although still within the range of perfect inequality. Hence, the situation shows that the policy that is being implemented in expanding the regency for the purpose of accelerating development is not successful. Expanding the regency means there will be an increase in the influx of people into it. The quality of human resources can also affect the rate of growth. North Sumatra Province is known as one of the provinces that has abundant natural resources. Therefore, this condition must be supported by the availability of human resources that can turn the raw materials into products that have and can contribute to regional income.
In conclusion, the increase in the number of regencies/cities cause the Williamson Index value to increase every year. The inequality of development initially has a small value and is on the range of moderate inequality. This situation means that the expansion of the regency carried out by the government lead to the greater inequality between the regions. Therefore, the government should review the policies that have been set in order to achieve the desired development objectives. The government’s efforts to reduce development problems in North Sumatra Province were documented in the North Sumatra Provincial Governor’s Response report in 2014, namely the establishment of a policy focusing on efforts to address various development issues in the areas of improving the service sector, infrastructure, facilities and others. Improved quality of services such as education and health has been done to improve the standard of living of the community. Furthermore, in order to improve service delivery in education and health, support from infrastructure quality such as roads and transportation is essential. The improvement of this situation is being witnessed slowly since 2015 till now (Caessaria, 2015). Future studies on impact of regional expansion are suggested to include other parameters other than income and population, which is the limitation of this study.
References
- Afid Burhanuddin. (2013). Penelitian kuantitatif dan kualitatif.
- Ari Mulianta Ginting. (2014). Analisis ketimpangan pembangunan di Indonesia, Universitas Terbuka.
- Badan Pusat Statistika. (2017). Provinsi Sumatra Utara dalam Angka 2017.
- Bismar Arianto M. Si & Afrizal, M.Si. (2013). Fenomena Pemekaran Daerah di Provinsi Kepulauan Riau (Studi Pemekaran Daerah Di Kabupaten Bintan). Jurnal Selat, Oktober 2013, Vol. 1 No.1.
- Caessaria Indra Diputri. (2015). Pemprovsu Tetapkan 5 Kebijakan Pembangunan di Sumut. Wol-Waspada Online, 7 April.
- Carlos, R. A. (2001). Economic growth and regional income inequality in Brazil. The Annals of Regional Science, 35, 133-152.
- Dewan Perwakilan Daerah Republik Indonesia. (2013). Keputusan Dewan Perwakilan Daerah Republik Indonesia Nomor 16/ DPD RI/ I/ 2013-2014 Tentang Rancangan Undang-Undang Tentang Pengelolaan Daerah Perbatasan: Jakarta.
- Francisco, J. B. T. & Julio, M. G. (2015). Inequality and poverty in a developing economy: Evidence from regional data (Spain, 1860–1930). EHES Working Paper 78.
- Gluschenko, K. (2015). Williamson’s Fallacy in Estimation of Inter-Regional Inequality. Institute of Economics and Industrial Engineering, Siberian Branch of the Russian Academy of Sciences, Novosibirsk State University. Munich Personal RePEc Archive (MPRA), Paper No. 68019, 23 November.
- Hendry. C, Waspodo, T. S. & Khoirul, A. (2017). Income disparity in Gerbangkertosusila area of East Java Indonesia. International Journal of Economics and Financial Issues, 7, 14-18.
- Huang, Y. F. & Leung, Y. (2009). Measuring regional inequality: A comparison of Coefficient of Variation and Hoover Cocentration Index. The Open Geography Journal, 2, 25-34. Khairul Ikhwan Damanik, Tikwan Raya Siregar, Ivo Nilasari, Ahmad Khairuddin, Norpan Mufti, Gudo Siswoyo, Sutra Ningsih, Elfian Lubis & Bungaran Antinius Simanjuntak. (2010). Otonomi Daerah, Etnonasionalisme, dan Masa Depan Indonesia: Berapa Persen Lagi Tanah dan Air Nusantara Milik Rakyat. Jakarta: Yayasan Pustaka Obor Indonesia.
- Korpus Kristi Yohanes Darmo. (2017). Studi Tentang Pembentukan Daerah Otonom Baru (DOB) Kabupaten Pasar Senen. eJournal Ilmu Pemerintahan, 2017, 5(1): 353-366ISSN 2477-2458 (online), ISSN 2477-2631 (print), ejournal.ip.fisip-unmul.ac.id.
- Maya Panorama PhD, (2013). Disparities in Economic Development in South Sumatra Indonesia. Palembang: Syariah Faculty, State Institute for Islamic Studies Raden Fatah, South Sumatra Indonesia. International Conference on the Modern Development of Humanities and Social Science (MDHSS 2013). Peraturan Pemerintah Republik Indonesia No. 26 Tahun 2008.
- Prof. Mudrajad Kuncoro, PhD. (2014). Otonomi Daerah: Menuju Era Baru Pembangunan Daerah. Yogyakarta: Universitas Gajah Mada.
- Raheem, W. M., Oyeleye, O. I., Adeniji, M. A. & Aladekoyi, O. C. (2014). Regional Imbalances and Inequalities in Nigeria: Causes, Consequences and Remedies. Research on Humanities and Social Sciences, 4, 163-174
- Sjafrizal. (2012). Ekonomi Wilayah dan Perkotaan. Jakarta: PT Rajagrafindo Persada.
- Williamson, J. G. (1965). Regional inequality and the process of national development: A description of the patterns. Economic Development and Cultural Change: 3–84.
- Sri Rosliana Lubis. (2018). Analysis of Economic Development Disparities between Districts in North Sumatra. Journal of Economics and Sustainable Development, 9, 1-7.