Assessment of Potential Non-Tax Revenue in Malaysian Local Authorities
- Department of Real Estate, Faculty of Geoinformation and Real Estate, Universiti Teknologi Malaysia, Skudai, Johor
Journal of Business Management and Accounting 9(2) (2019) · https://doi.org/10.32890/jbma2019.9.2.8722
Abstract
Non-tax revenue trends and their potential have received less attention than property tax, which is the primary source for most Malaysian local authorities (LAs). This paper highlights the examination conducted on potentials and strategies adopted by each LA investigated to maximize return from non-tax revenue. In doing this, qualitative approach using secondary data acquired from financial reports and primary data from in-depth interviews was employed. Ten LAs were selected through purposive sampling. The trend of revenue collection among the selected LAs and the strategies to improve non-tax revenue collection through thematic analysis are highlighted. The analysis of the trend of local authorities’ revenue reveals that non-tax revenue remains the second most important after the tax revenue. However, Pulau Pinang City Council (MBPP) is the only LA that records an average of non-tax revenue exceeding 50 per cent of its total internal revenue. This study has also found that the divergence among the local authorities’ non-tax revenue collection is due to the revenue improvement strategies adopted by each local authority. Therefore, eight recommendations are made to improve non-tax revenue. Though this study is limited to 10 LAs as sample, the successful optimizing strategies highlighted from the study can represent an efficient model for other LAs, in improving their non-tax collection.
Keywords: Authority, Non-tax Revenue, Optimizing Strategy
1.0Introduction
The Malaysian Ministry of Rural Development (2018) has shown that the rate of population growth in urban areas has increased by 47 per cent; which 26.9 per cent in 1970 and 75.6 per cent in 2018. Rapid population growth in urban areas will increase the cost of providing public services (Ladd, 1992; Nakamura and Tahira; 2008; Solé- Ollé and Hortas-Rico, 2010). Therefore, local authorities must have adequate and * Email: nurberahim@gmail.com, nadzrijaafar@utm.my, ainurzaireen@utm.my sustainable financial resources. However, in Malaysia, the research conducted by Ibrahim and Abd Karim (2004); Atan et al (2010) and Mohamed, Mohd Yusof and Ab Majid (2013) highlighted LA’s frequently running deficit budget issue. Hence, this study focuses on how LAs can increase their income through non-tax revenue despite the fact that deficit budget can be caused either by decrease in income or increase in expenses.
According to Salleh and Siong (2008), LAs need to be proactive in identifying ways to generate additional financial sources such as by improving collection methods and diversifying their revenue sources. It is interesting to investigate whether LAs can broaden their revenue more creatively under tax or non-tax revenue. In Malaysia, it is well known that property tax is the major source of income among LAs. This fact has been identified as a reason for the limited literature concerning the significance of non-tax revenue. Although property tax is acknowledged as the main revenue by most LAs worldwide, there are several studies that addressed the need to probe into other revenues rather than property tax. Januta (1968) claimed that the primary reliance on the property tax to finance public services and infrastructure was inadequate in California. While according to Caroll (2009), LAs began to diversify their revenue structures away from the reliance on property taxation in response to the property tax revolts initiated by California’s Proposition 13, which forced limits on property tax growth. However, these two studies did not focus on non-tax revenues as income that could replace the dependency on property tax revenue. Meanwhile, in Canada, Slack (1996) predicts that user fees will likely rise in the future when municipalities are more fiscally strained, while Collin et al (2003) indicated that the relative importance of user fees in Canada has risen compared to the increase in property taxes since the 1980s.
According to Park (2017), the revenue potential of these non-tax sources becomes considerable and attractive for local governments, but there has been relatively little academic attention to non-tax revenues. Therefore, it is necessary to conduct a research on the current achievement and potential of non-tax revenue in Malaysia. This study provides a view on the current potential of non–tax revenue based on their trend and the official views from LA. The first objective is to perform trend analysis as an effort to evaluate the achievement of non-tax revenue from 2013 to 2015. The second objective is to identify the potential and the third objective is to identify the strategies being adopted in enhancing the non-tax revenue.
2.0Literature Review
Local authorities are statutory bodies which have to act in accordance with their legal requirement and can be sued through the court if they take actions beyond their powers. They are responsible for mandatory and discretionary functions as prescribed in Local Government Act 1976 in their specific geographical areas. According to Assessment of Potential Non-Tax Revenue in Malaysian Local Authorities: 1-21 3
Ibrahim (2014), the mandatory functions include all critical functions such as refuse collection, maintenance of minor drainage, sewerage treatment, road maintenance, street lighting and activities pertaining to public health. The discretionary functions include all development function such as providing amenities, recreational parks, housing and commercial activities, markets, sports facilities, and community centers. Local authorities are facing the problem of inadequate finance when the expenditure exceeds their revenue or fiscal needs outrun fiscal capacity (Dubravka, 2007; Atan et al, 2010; Rode, 2011, Wong, 2014). Inadequate financing influenced either by insufficient income generation or expenditure excessiveness.
2.1Revenue Structure
The LA revenue structure is depicted in Figure 1 to facilitate a clearer understanding on this study.
Local authority revenue sources
Internally Internal generated generatedrevenue revenue External generated revenue
Tax revenue Non-tax revenue Non-revenue receipt
             Assessment
              Property             Service fees and charges                        Rentals             Government grant
                 tax
                 tax
                                   Interest from investment                Return from sales            Repayments and
            Contribution                                                                                reimbursements
            in aid of rates         Fines and Compounds                  Licenses and permits
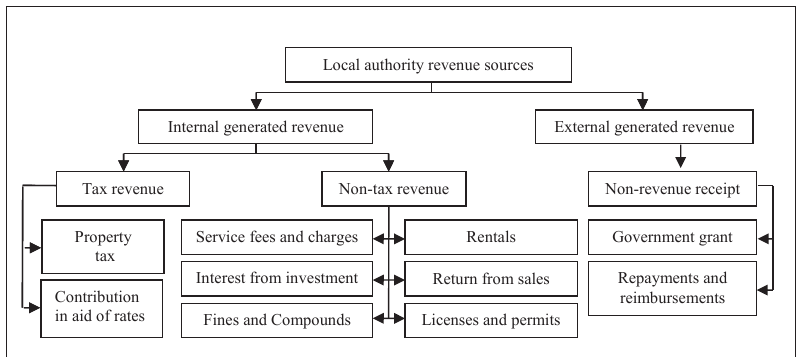
the terms related to non-tax revenue discussed in the literature, such as user fee, charge, service charge will be referred as non-tax revenue.
In addition, the term non-tax revenue refers to the six revenue sources as described in Table 1. Several sources are referred to in describing the meaning of each non-tax revenue category such as Malaysian Productivity Corporation, MPC (2016), Germân and Glass (2016), and Mohd Talib, Mohd Ismail and Adelabu (2017). In addition, all the terms related to non-tax revenue discussed in the literature, such as user fee, charge, service charge will be referred as non-tax revenue.
| Service fees and | urban service, charged on searching information and parking. The |
|---|---|
| charges | breakdown of these categories is greater compared to other non-tax revenue’s categories. Licenses are levied by local authorities for controlling and regulating the establishment, ownership, and operation of business activities to ensure |
| Licences and | they are in line with legislated regulation and policies applicable in their |
| permits | administration. Revenue from movable and immovable property that is approved by the |
| Return from | state government for sale. |
| sales | Payment arising from the right of use and occupying local authorities’ properties such as stalls, market, hawkers, business and commercial |
| Rental | complex, sport and recreation facilities, auditorium and halls. A penalty assessed as a result of the violation of law, contract, agreement and right such as littering, dumping of household refuse, hawking without |
| Fines and | valid licenses, and also illegal or wrongful parking within the local |
| Compound | authority areas. Profit earned from investments made in commercial banks and finance |
| Interest from | companies |
| investment | The revenue data from 10 LAs involved in this study shows that the range of internal revenue is between 84.23 per cent and 97.75 per cent. This indicates that LAs involved in this study are less dependent on non-revenue receipt. Therefore, responding to LAs financial constraint, they must take efforts twice as much to increase their tax and non- tax revenue. The capability of tax revenue as the main source of revenue cannot be questioned anymore. Hence, a study on non-tax revenue potentials should be conducted to balance the literature gap between the tax and non- tax studies on the approaches in |
| increasing the revenues of LAs. |
2.2The Need to Explore Non-Tax Revenue Potential
LAs are now facing several issues related to finance. They include shortage of revenues or deficit in budgets (Mohamed and Atan, 2006; Singaravelloo, 2008), providing the services without adequate financial resources (Kaganova and Nayyar stone, 2000; Jolicoeur and Barret, 2004; Salleh and Siong, 2008; Hanis, Trigunarshah and Susilawati, 2010), more attention spent on the well-being of the community instead of profitability (Mohamed and Atan, 2006), reduction on grant transfer from the higher government (Collin et al., 2003; Tschekalin, 2011), limited power to increase revenue due to central government control (Gideon and Alouis, 2013).
In response to these issues, LAs need to diversify, grow and stimulate their revenue sources vigorously. However, this is difficult to accomplish through property tax. This is because property tax is lacking in revenue elasticity as it typically exhibits little revenue growth (Alm, 2013; Vazquez, 2015). In a study by Alm (2013), it was noted that property tax is an inelastic source of revenue due to administrative problems in identifying properties, valuing them, conducting revaluation, collecting revenues, enforcing penalties and also the political restriction. However, in his conclusion, the author agreed on two facts. First, the reliance on property tax has proven to be “a convenient truth” as this revenue seems likely to continue for the immediate future. Second, he agrees that much evidence suggests that the reliance on property tax should not be discouraged. However, McMillan and Dahlby (2014) denied the property tax as inelastic or an inadequate source of revenue to LAs. In this study, the revenue elasticity was measured based on the collection efficiency trend for both revenues. It was done by comparing between actual revenue and projected revenue. The revenue that shows the unpredictable trend in collection efficiency indicates the sign of revenue elasticity.
Property tax is indeed recognized as the primary revenue to LA, but the development of the non-tax revenue is seen to be growing and becoming more attractive (Moisio, 2002; Shirimia and Rutamu, 2004; Warner and Pratt, 2005). The relative importance of non-tax revenue (user fee) is due to the declining grant transfer, the problem in taxation instruments and difficulty in raising property tax especially during elections (Collin et al., 2003; Amborski, 2004). From another point of view, there are some studies that affirm the advantages of non-tax revenues, but they are limited to certain conditions. Spearman (2007) states that user charges are good in principle but difficult to implement effectively for various reasons such as inadequate pricing strategy and restriction by laws. Other obstacles in establishing and developing non-tax revenue includes the complexity of the legal basis for setting and managing, slow progress in the development of corporate strategies for managing charges, LAs does not capture all options to generate income, political consideration, LAs have limited power in expanding variety of effort in generating revenues, the charges do not reflect the true cost of running services, and lastly the need to balance the income generating aspiration with the ability of the public to pay for the services. (Tschekalin, 2011; Wales Audit Office; 2016).
The development of non-tax revenue is also driven by the diversification of possible improvement methods as efforts to increase this revenue. The various options to expand the non-tax revenue suggested in numerous studies include public-private partnership or privatization (Shirimia and Rutamu, 2004; Hussain and Brahim 2006; Salleh and Siong, 2008; Manganelli and Tajani, 2013); developing a checklist of best practice for expanding non-tax revenue (Germân and Glass, 2016), disposing of unprofitable assets and keeping only the profit-making ones (Shirimia and Rutamu, 2004), maximize the utilization of existing LAs’ assets (Shirimia and Rutamu, 2004), revision of rates of rents according to a market value (Ayupov and Kazakovtseva, 2014), and generating revenue through parking (Shoup, 2004). Beside these, there is a mixed picture of the sources of generating income as non-tax revenue such as transportation services (e.g. parking, harbor, terminal, depot, circuit), land and building development (e.g. public- private partnership, building plans, planning permission, material change, landscape plan, engineering plan, advertising display, transmitting tower and telecommunication), building and land control (e.g. licensing and permits), business facilities (e.g. hawker, stall, food court,) public facilities (e.g.: stadium, hall, aquatic centre, field, gymnasium, arena), and urban services ( e.g. garbage collection, recycling centre, funeral, the capturing of wild animal). This diversity of sources becomes one of the factors that distinguish the non-tax income between LAs. If all these sources are exploited with effective strategies, then LAs can generate higher incomes from non-tax revenues.
There are no academic studies in Malaysia that can be reviewed to get the idea of non- tax revenue potential among LAs. However, the information from Shah Alam City Council’s (MBSA) Strategic Plan can be used to demonstrate the potential of non- tax revenue is as shown in the table 2. Within 5 years, the highest expected KPI for tax revenue is about 5 percent and 18 percent for non-tax revenue. Although the total expected revenue of tax revenue is much higher than non-tax revenue, non-tax revenue is considered more possibly to be enhanced through efficient and creative strategies.
Overall, this study acknowledges the property tax as a stable and predictable source of revenue. However, it does not mean that LAs can rely adequately on this revenue. This is because the property tax is difficult to develop creatively compared to non-tax revenues that comprise various sources.
| Strategy | Program / initiative | Key Performance Indicator (KPI) |
|---|---|---|
| 1) Increase property tax | 2016- An increase of 3% (RM 266.7 million) | |
| revenue through: | 2017- An increase of 4% (RM 277.4 million) | |
| i. Increased number of | 2018- An increase of 4% (RM 288.5 million) | |
| property holdings with | 2019- An increase of 5% (RM 301.9 million) | |
| the development of new | 2020- An increase of 5% (RM 318 million) | |
| areas | ||
| ii. Revaluation of existing | ||
| Strengthen property | ||
| the | ||
| finances | ||
| of the 2) | Increase non- tax revenue 2016- An increase of 3% (RM 136.3 million) | |
| Council through: | 2017- An increase of 12% (RM 152.7 | |
| i. | Increase in revenue from million) | |
| car parks | 2018- An increase of 14% (RM 174.0 | |
| ii. | Increase license revenue million) through law enforcement 2019- An increase of 16% (RM 201.9 | |
| iii. Increase | of rental million) | |
| revenue from premises | 2020- An increase of 18% (RM 232 million) |
3.0Methodology
This study involved 10 selected LAs based on four criteria of purposive sampling. In the early stage, the sample for this study included 15 LAs that fit the criteria of revenue exceeding MYR 100 million, high urban occupancy rate, high degree of self- financing revenue and professional referrals. However, post data collection, the final sample consisted only 10 LAs. The other five LAs were excluded from this study due to incomplete data.
The first source of data was secondary data gathered from gazetted financial statements from 2013 to 2015 obtained from the LAs Treasury Department. This data was used to present a trend analysis of non-tax revenue. This was done using the Microsoft Office Excel. The analysis of trend could lead to credible and reliable insight on the actual achievement of non-tax revenue for each LA rather than making mere assumptions about them. Out of 15, only 12 LAs agreed to provide the required data. This result was expected because according to Tayib, Coombs and Ameen (1999), it was rather difficult for the public to assess the LAs financial information. The financial data was expressed in the form of percentage using specific formula to ensure better comparison of income trends among the LAs investigated.
The second source of data used to achieve the second and third objectives was the primary data which was obtained through in-depth interviews with officers from the Department of Valuation and Property Management of the investigated LAs. The semi- structured interview was the most appropriate approach to use because it allowed the interviewer to ask additional questions should an interesting or new line of inquiry developed during the interview (Young et al, 2018). Out of 15 samples, 13 LA agreed to participate in the interview sessions. Hence, only 10 LAs were selected as the final sample as they fulfilled the two data sources needed for the analysis. The respondents are represented by codes as shown in Table 3.
| Shah | Pulau | Johor | Iskandar | Subang | Seberang | Pasir |
|---|---|---|---|---|---|---|
| Ipoh Selayang | Klang | |||||
| Alam | Pinang | Bahru | Puteri City Municipal | Jaya Municipal | Perai | Gudang |
| LA City | City | City | City Council Council | Municipal Council | Municipal | Municipal |
| Council | Council | Council | Council (MBI) (MPS) | Council (MPK) | Council | Council |
| (MBSA) | (MBPP) | (MBJB) | (MBIP) | (MPSJ) | (MPSP) | (MPPG) |
| Code R1 | R2 | R3 | R4 R5 R6 | R7 R8 | R9 | R10 |
Each interview session was recorded and permission was granted by the interviewees. The interviews were conducted in one session for each LA and generally covered approximately 30 minutes. To explore the result, thematic analysis was used to determine the respondents’ view on non-tax revenue potential in the future and also the strategies adopted by LAs to increase the collection of non-tax revenue. According to Braun and Clarke (2012), thematic analysis was an efficient method in systematically identifying, organizing, and offering insights into patterns of meaning (themes) across a data set. Besides, verbatim quotation of what respondents said was also used to elaborate the thematic analysis.
4.0Results
The discussions of findings were described based on the data source. Financial information from secondary data was used to perform trend analysis while information from the interview was used to conduct thematic analysis.
4.1Trend Revenue Analysis
Trend revenue analysis evaluated LAs’ financial information over a period of time from 2013 to 2015. To complete the trend analysis, the information from financial statements was expressed in term of percentages. The goal was to make a comparison between tax and non-tax revenue.
4.0Results
4.1Trend Revenue Analysis
The discussions of findings were described based on the data source. Financial information from secondary data was used to perform trend analysis while information from the interview Trend revenuewasanalysis used toevaluated conduct thematicLAs’analysis. financial information over a period of time from 2013 to 2015. To complete the trend analysis, the information from financial statements was 4.1 of expressed in term Trend Assessment Revenue Non-TaxAnalysis percentages. of Potential The goal was to make a comparison between tax and non- Revenue in Malaysian Local Authorities: 1-21 9 tax revenue. Trend revenue analysis evaluated LAs’ financial information over a period of time from 2013 to 2015.
4.1.1To complete
                                  Comparative     the trend
                                               Analysis     analysis,
                                                         on Tax       the information
                                                                and Non-tax    Revenuefrom financial statements was
4.1.1Comparative Analysis
expressed in termon of Tax and Non-tax percentages. Revenue The goal was to make a comparison between tax and non- tax revenue. The first evaluation was made by comparing the trend of tax and non-tax revenue. The The first evaluation formula was ismade used by comparing illustrated in the the trend ofand taxtheand non-tax revenue. The
4.1.1Comparative Analysis on Taxfollowing textbox
and Non-tax Revenue results are shown in Figure formula used 2. is illustrated in the following textbox and the results are shown in Figure 2. The first evaluation was made by comparing the trend of tax and non-tax revenue. The formula used is illustrated in the following textbox and the results are shown in Figure 2. Tax revenue/ Non-tax revenue x 100% Internally generated revenue Tax revenue/ Non-tax revenue x 100% Internally generated revenue Tax and Non tax revenue trend according to local authority 90.00% 2013 Tax Tax and Non tax revenue trend according to local authority 80.00% 90.00% revenue 2013 Tax 80.00% revenue 2013 Non- 70.00% 70.00% 2013 Non- tax revenue Percebtage (%)
60.00% tax revenue Percebtage (%)
                                               60.00%                                                                                          2014  Tax
                  50.00%                                                                                                                      2014 Tax
                                               50.00%                                                                                          revenue
                                                                                                                                              revenue
                  40.00%                       40.00%                                                                                          2014Non-
                                                                                                                                              2014   Non-
                  30.00%                       30.00%                                                                                         tax
                                                                                                                                               taxrevenue
                                                                                                                                                   revenue
                                               20.00%                                                                                         2015 Tax
                  20.00%                                                                                                                       2015 Tax
                                                                                                                                              revenue
                                               10.00%                                                                                          revenue
                  10.00%                                                                                                                      2015 Non-
                                                0.00%                                                                                          2015
                                                                                                                                              tax    Non-
                                                                                                                                                  revenue
                   0.00%                                MBSA      MBPP     MBJB     MBIP     MBI     MPS      MPK       MPSJ   MPSP    MPPG   tax revenue
                           MBSA                 MBPP       MBJB      MBIP         MBI       MPS        MPK
                                                                                            Local authority      MPSJ      MPSP       MPPG
                                                                                  Local authority
The figure itself is in the PDF version.
The figure itself is in the PDF version.
revenue by 0.92 per cent. To sum up, tax revenue was still the main revenue among the LAs in 2015. In that year, tax revenue exceeded non-tax revenue by 0.92 per cent. To sum studied. However, MBPP became the only LA which had the average of non-tax revenue up, tax revenue was still the main revenue among the LAs studied. However, MBPP exceeding 50 per cent of its total internal revenue. MBPP has proven that non-tax revenue has became the only LA which had the average of non-tax revenue exceeding 50 per cent the potential to become a stable source of income for LAs. of its total internal revenue. MBPP has proven that non-tax revenue has the potential to become a stable source of income for LAs.
The analysis continues by taking average of three years’ revenues (tax and non-tax) to determine LAs rankings with the highest non-tax income as shown in table 4. The The analysis continues by taking average of three years’ revenues (tax and non-tax) to determine LAs rankings with the highest non-tax income as shown in table 4. The ranking was basedranking on thewaslargest basedaverage percentage on the largest averagefor non-tax for percentage revenue non-taxlabeled revenuegrey in grey labeled Table 4. MBPP hasintheTable 4. MBPP has the highest non-tax revenues, followed by MBSA, MBJB, MPS with highest non-tax revenues, followed by MBSA, MBJB, MPS and MPK non-tax revenues and MPKranging from revenues with non-tax 30 to 39 per cent. ranging from While 30 to 39MPSJ, MBI per cent. MBIP, While MPSJ,MPSP MBI and MPPG areThea group of analysis LAs with continues byan average taking non-tax average of revenue three ranging years’ from revenues 24 (tax to and MBIP, MPSP and MPPG are a group of LAs with an average non-tax revenue ranging 26 per cent. non-tax) to determine from LAs 24 to rankings per cent.with 26 continues the highest non-tax income as shown in table 4. The ranking The analysis by taking average of three years’ revenues (tax and non-tax) to was based on the largest average Table 4 determine LAs rankings with the highest percentage for non-tax revenue labeled grey in Table 4. non-tax income as shown in table 4. The ranking MBPP has the highest non-tax revenues, followed by MBSA, MBJB, MPS and MPK with was based Table 4 on the largest average percentage for non-tax revenue labeled grey in Table 4. non-tax MBPP revenues has the ranging highest from revenues, non-tax 30 to 39 followed per cent.byWhile MBSA, MPSJ, MBJB, MBI MPSMBIP, MPSP and MPK withand Average Revenue MPPG Percentage are a group of for LAsTax and with an Non-tax average Income revenue non-tax ranging from 24 to 26 per cent. non-tax revenues ranging from 30 to 39 per cent. While MPSJ, MBI MBIP, MPSP and Average Revenue Percentage for Tax and Non-tax Income MPPG are a group of LAs with an average non-tax revenue ranging from 24 to 26 per cent. LA Table MBPP 4 MBSA MBJB MPS MPK MPSJ MBI MBIP MPSP MPPG Tax 46.66 60.52 67.16 69.54 69.60 74.05 74.37 74.43 74.61 MPPG76.30 Table LA 4 MBPP MBSA MBJB MPS MPK MPSJ MBI MBIP MPSP revenue Average% Tax Revenue % 46.66 Percentage 60.52 % for % Tax and69.54 67.16 % Non-tax69.60 % Income 74.05 % 74.37 % 74.43 74.61 % 76.30 % Non-tax Average 53.34 Revenue revenue %39.48Percentage % 32.84 % 30.46 % 30.40 % for Tax and Non-tax Income25.95 % 25.63 % 25.57 % %25.39 % 23.70 revenue Non-tax LA % 53.34% MBPP 39.48 % MBJB MBSA 32.84 % 30.46 MPS %30.40 MPK % MPSJ 25.95 % MBI 25.63 % MBIP 25.57 25.39% MPPG MPSP 23.70 % TaxLA revenue 46.66 % MBPP 60.52 % MBSA 67.16 % MBJB 69.54 % MPS 69.60 % MPK 74.05 % MPSJ 74.37 MBI% 74.43 % MBIP 74.61 MPSP% 76.30 % MPPG revenue Tax % 46.66 % 60.52 % 67.16 % 69.54 % 69.60 % 74.05 % 74.37 % 74.43 % 76.30% 74.61
4.1.2Comparative
Non-tax Analysis revenue 53.34 of 39.48 the32.84 Collecting Efficiency Ratio 25.63 (CER) 25.57 between Tax %and Non- 4.1.2 tax Revenue % Comparative % Analysis % of the30.46 % 30.40 % Collecting 25.95 % Efficiency % Ratio % (CER) %25.39 between Tax23.70 and revenue Non-tax % 53.34 % 39.48 % 32.84 % 30.46 % 30.40 % 25.95 % 25.63 % 25.57 % 23.70% 25.39 Non-tax revenue % Revenue % % % % % % % % % Next, the4.1.2 Comparative analysis Analysis continued withof the the Collecting Efficiency Ratio second comparison (CER) which wasbetween Tax and Non- the evaluation made 4.1.2 Next, Comparative the tax analysis Revenue Analysis of the continued Collecting with the Efficiency second Ratio (CER) comparison between which was Tax evaluation the and Non- based on the collecting efficiency ratio (CER). This was calculated using the formula in the tax Revenue made based on the collecting efficiency ratio (CER). This was calculated using the textbox below Next, andanalysis the Figurecontinued 3 illustrates with thesecond outcome from this formula. The comparison made of formula Next, inanalysis theandthe textbox below continued andthe with Figure the second comparison 3 comparison illustrates which the was the outcome which from was the evaluation this formula. evaluation made CER between tax non-tax revenue will be presented after these. based on the collecting efficiency ratio (CER). This was calculated using the formula in the The comparison based of CER on the collecting betweenratio efficiency tax (CER). and non-tax revenue This was will be calculated presented using afterinthese. the formula the textbox below and Figure 3 illustrates the outcome from this formula. The comparison of textbox below and Figure 3 illustrates the outcome from this formula. The comparison of CER CERbetween betweentax taxand andnon-tax non-taxrevenue revenue will will be presentedafter be presented afterthese. these. Actual revenue x 100% Projected revenue Actual Actual revenue revenue Projected xx100% 100% Projected revenue revenue CER OF TAX REVENUE CER OF NON-TAX REVENUE 140.00% 300.00% CER OFOF CER TAX TAXREVENUE REVENUE CEROFOFNON-TAX CER NON-TAX REVENUE REVENUE 120.00% 140.00% 140.00% 250.00% 300.00% 300.00%
100.00% 120.00% 120.00% 250.00% 250.00% 200.00% Percentage (%)
Percentage (%)
100.00% 100.00% 80.00% 200.00% 200.00% Percentage (%)
(%) Percentage (%)
Percentage (%)
80.00% 150.00% 80.00% Percentage
60.00% 150.00% 150.00% 60.00% 60.00% 100.00% 100.00% 100.00% 40.00% 40.00% 40.00% 50.00% 50.00% 50.00% 20.00% 20.00% 20.00% 0.00% 0.00% 0.00% 0.00% 0.00% MBSAMBPP MBPP MBJB MBI 0.00% MBSA MBPP MBJB MBI MPS MPK MPSJ MPSP MPPG MBSA MBSA MBPPMBJB MBIMPS MBJB MBI MPS MPK MPK MPS MPSJ MPSP MPSJ MPK MPSJ MPPG MPSPMPSP MPPGMPPG MBSA MBPP MBSA MBJBMBPP MBIMBJB MPSMBIMPK MPSMPSJ MPKMPSP MPSJ MPPG MPSP MPPG Local Authority Local Authority Local Authority Local Authority Local Authority Local Authority 2013 2014 2015 2013 2014 2015 2013 2015 2014 2015 2013 2013 2014 2014 2015 2015 2013 2014
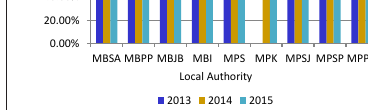
CER of tax revenue was more stable because most of the studied LAs approached the red line compared to tax revenue. Second, both graphs showed a tremendous increase in the trend.
Figure 3 illustrates a significant different result of CER trend between tax and non-tax revenues. The target of 100 per cent collection became the main indicator in comparing the two sources of revenue. This was marked with a dashed red line. There are four points that emerged as comparative bases in this analysis. The first was the stability of CER. Overall, the CER of tax revenue was more stable because most of the studied LAs approached the red line which marked 100% collection. While CER of non-tax revenue showed unpredictable trend compared to tax revenue. Second, both graphs showed a tremendous increase in the trend. For tax revenue, MPPG had a significant increase in 2015 which was 130.87 per cent compared to 86.74 per cent in 2014. While for the non-tax revenue, MBSA had a sudden increase of 259.98 per cent in 2014 compared to 71.25 per cent in the previous year.
Next, the discussion is on the comparison made based on the CER achievement of more than 100 per cent for three consecutive years. For the tax revenue, only MBJB achieved CER exceeding 100 per cent for three consecutive years. While for the non- tax revenue, three LA achieved CER of more than 100 per cent. The fourth comparison was made based on the range of CER more than 100 per cent. For the tax revenue, the range was between 100 per cent and 130.87 per cent. The range for non-tax revenue was between 100 per cent and 259.98 per cent. These four comparisons of CER are shown in Table 5.
| CER Of Tax Revenue Comparison CER Of Non-Tax Revenue |
| More stable because most of the |
| Stability of Unpredictable collection |
| LA approaching the red line |
| Collection compared to tax revenue |
| CER of MBSA is suddenly |
| MPPG rose dramatically in 2015 rising to 259.98%in 2014 |
| Tremendous Trend of |
| which is 130.87% compared to compared to 71.25% on the |
| Collection |
| 86.74% in 2014 previous year |
| CER more than100% |
| MBJB for 3 years MBPP, MBJB and MPSJ |
| The range of CER |
| 100.00% - 130.87% exceeding 100% 100.00% - 259.98% |
To sum up, tax revenue becomes the most stable revenue yet inelastic for LAs in Malaysia. Hence, this finding is contrary to the study of McMillan and Dahlby (2014)
which concluded that tax revenue is elastic. Meanwhile, non-tax revenue is characterized as the most elastic income for LAs. This means there are many ways to enhance the revenue from each category of the non-tax revenue. In addition, this analysis is also contrary to the statement by Fjeldstad et al (2003). They authors state that one major administrative problem for the LA today is their inability to fully collect revenue due to them because there are huge gaps between reported and projected revenues. Contrary to that statement, this analysis has shown that the collection of most LA is approaching or exceeding 100 per cent.
4.2Potential and Strategies adopted to Enhance Non-tax Revenue.
In-depth interviews were conducted to obtain the respondents’ views on two matters. First, to know their perceptions and expectations on potential non-tax revenue for the future. Second, to determine the strategies and approaches that has been taken by LAs to improve their non-tax revenue collection.
4.2.1The Respondents View on the Potential of Non-tax Revenue
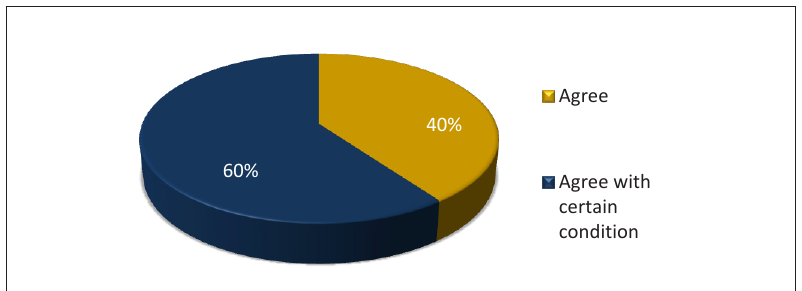
Questions were asked to determine whether the respondents agreed that dependency on tax revenue was insufficient and there should be a need to explore non-tax revenue extensively. Figure 4 shows the answers given by the respondents.
Agree 40%
60% Agree with certain condition
tax revenues. This is due to three factors which are, first, there are some of the LAs that became more saturated with time and this would limit new development. Slowing in new development will limit the addition of new property that can be charged through property tax. Second, the revaluation of tax base becomes a difficult task for LAs due to the difficulties in revenue was essential because it can be continually earned throughout the year at any time. On the other hand, R7 and R8 emphasized the importance of non-tax revenue due to the difficulties in expanding the tax revenues. This is due to three factors which are, first, there are some of the LAs that became more saturated with time and this would limit new development. Slowing in new development will limit the addition of new property that can be charged through property tax. Second, the revaluation of tax base becomes a difficult task for LAs due to the difficulties in getting the approval from the state authority. Third, the returns from tax revenue did not show significant changes between years. Therefore, all departments within LAs must work very hard to identify the reasonable services to be charged and think actively in generating ideas on how to improve non-tax revenue collection.
The other 60 per cent of the respondents who were coded as R2, R3, R4, R5, R6, and R9 also agreed with the question but this was conditioned by certain factors. According to R2, LAs needed to diversify new non-tax revenue to cover up the shortfalls in tax revenue while R3 emphasized that LAs needed to put more efforts in increasing revenue by operating businesses and investments like the private sector. However, these two respondents along with the other four respondents stated several conditions and limitations that should be taken into consideration. First, the effort to enhance this revenue depended on the capacity and capability of the resources available such as staff that had the expertise and determination, sufficient workload and financial resource (R2, R4). Second, any approach to increase the non-tax revenue can be realized without neglecting the role of LAs as service providers to the public and non-profit oriented organizations (R2, R5). Third, the approval of the proposal to impose non-tax revenue is subject to the consent of the council and the state authority (R3). Next, R5 and R6 mentioned objections from the state government policies. This was because the state government policies affected the management style within LAs (R5). For instance, R6 says that “if the state government can easily approve land disposal to local authorities, then non-tax revenue can be extended extensively. However, since government policy seeks to focus more on public benefit, we are more concerned about tax revenue”. Meanwhile, R4 suggested that there was a need to create a focus group to conduct a comprehensive study to figure out the new revenue that could really be implemented by local authorities. The last two conditions were the obstacles from political intervention (R5) and the leadership that constantly support efforts to improve the non-tax revenue (R9).
Overall, the findings above are in conformity with the statement by Spearman (2007). The respondents are aware of and they acknowledged that the LAs should not rely solely on property tax, while the non-tax revenue was an imaginative source of revenue to LAs. Although there are several conditions or limitations mentioned by majority of the respondents, these could be managed and improved by adopting comprehensive strategies.
4.2.2Strategies adopted to Enhance Non-tax Revenue Income
The strategies pertaining to the knowledge and experience of LA staff that can be adopted to enhance non-tax revenue income will be described based on the relevant themes:
(i) Creating more property related to non-tax revenue.
Contrary to the property tax, local authorities need to build the property or create services so that they can charge whereas the property that is subjected to property tax is not constructed by LAs. Therefore, creating more immovable property will increase the source of non-tax revenue (R1, R6). There are six approaches to add on more properties which generate non-tax revenue. First, LAs can buy properties such as lands, buildings and resorts. Secondly, LAs can make an application for land from the state government. Next, LAs receives public amenities built by the developer through planning permission compliance. Fourth, LAs also receives property from the state government through the State Economic Planning Unit (UPEN). The next approach is via privatization or joint venture or Public Private Partnership. Usually, LAs receives the property as in-kind return while under the scheme Built, Operate, and Transfer (BOT), LAs will own the property after the end of the period according to the contract. LAs must ensure that the project being developed is viable and durable so that after the contract expires, they will receive such property that are still profitable. Lastly is the request for proposal (RFP). Through RFP, LAs will ask the property firms to submit a proposal for developing a project that they desire such as affordable housing, public halls, business center, parking places and tourists’ facilities. The RFPs enable LAs to provide public facilities when they are not capable of providing it due to staff and financial constraints (R2).
(ii) Attempt to explore the new area of non-tax revenue sources.
Some LAs are courageous in presenting new revenue ideas but the implementation is subject to the state government’s approval. The first example is the idea of establishing a subsidiary company as a special entity that manages the LA’s property for business and investment. This idea has been proposed, but it has not been approved due to legal reasons (R3, R6). The second example, R6 stated that MPS planned agar wood as a new approach to diversify non-tax revenue. Apart from the nursery plan, this is the new field of revenue which this LA is trying to explore. The third example of new revenue is the sales of e-valuation (software) developed by MPSP. The list of LAs that has purchased this system from MBSP includes MPK, MPSJ and MBPP. Apart of MPSP, MBI has also developed a system called Easy Electronic Tree Data Collection (eZe3@MBI) as an innovative product by Landscape Department. This system has won the National Intellectual Property Awards 2017 under copyrighted category. Besides, R5 state that this system has been bought by the state government of Perak. The last example is the production of compose from food waste. So far the LAs that actively work on compost production include MBPJ, MBSA, MPSA and MPK. The main purpose is not to generate profit as it is more intended to raise public awareness on the necessity for food waste recycling. Nevertheless, the LAs are able to generate additional income from this initiative. A local newspaper has reported that MPSJ’s sales of compost derived from food waste has jumped from RM9, 000 to RM20, 000 within two years (Chen, 2017).
(iii) Strengthening the enforcement and monitoring in efficient way.
According to R1, LAs should enforce commercial property laws more strictly. An example of enforcement exercised by MBJB was described by R3 which is the termination of the lease agreement on a uniformed date. R3 said “all tenants need to sign a new agreement which will expire on the same date within three years. This implementation enables the LAs to collect rental arrears because the tenant with arrears should make payment before being allowed to sign a new rental contract”. Moreover, LA is easy to conduct monitoring and enforcement for rental revenue. Besides that, R3 also suggested that LAs should enforce the penalty seriously on property owners who failed to submit notification of Change of Ownership (Form I) to LA. According to R3, so far, the enforcement of this penalty is still weak in his organization. Besides, LAs also should not process the complaints from the tenant who have an outstanding as one method of enforcement (R10). While for monitoring purpose, R7 suggested that LAs should improve the application of computing technology in order to facilitate and monitor non-tax revenue collection through the provision of e-book, e-license, e-rental, e-valuation, e-privatization and any other system applicable. Although there is no one integrated system that combines all the sources and information on non-tax revenue, it is better than the traditional systems such as Microsoft Excel, which is still used by some LAs.
(iv) Getting any related information on non-tax revenue from other LAs.
Knowledge sharing initiative is one of the best approaches to improve non-tax revenue. It contributes to continuous improvement because the achievement of one LA will be emulated by the other LAs. According to R8, non-tax revenue is less discussed in formal meetings among LAs, compared to tax revenue. As a result, all LAs moves independently to obtain the non-tax revenue’s information and achievements from other LAs. As a result, the sharing of knowledge becomes limited. For example, despite being under the same state, R4 from MBIP do not know that termination of the lease agreement on a uniform date as an effective monitoring strategy has been implemented by MBJB. Overall, non-tax revenue can be improved if knowledge sharing is formally and continuously observed among LAs.
(v) Resource exploitation to their highest and best use.
The land and building within LAs’ administrative areas should be utilized creatively and productively. The following examples show the best possible exploitation of the resources to generate more money under non-tax revenue. The first example is the development of integrated building for several purposes and facilities. The integrated building can be developed either for commercial or public purpose. The Ipoh Convention Centre under MBI is an example of an integrated building for commercial purpose as it comprises a convention centre, hotel and service apartment (R5) While, Children and Community Creativity Complex (3C complex) and Kompleks Kemudahan Masyarakat (3K complex) owned by MPSJ is another example of integrated building mainly for public purpose (R8). The diversity of use in one place can attract more users to use the services with an appropriate fee. The next example is utilizing strategic space for advertising purposes (R3). Local Authorities in urban areas have more advantages since the demand for advertizing space is higher. The third example is the space rental for telco services. According to R5, MBI receives the application to install the Telco structures on the street lighting poles, while in MBJB, the telco companies are renting the top of buildings owned by the LAs for their structures (R3). The last example is that the LAs can be suppliers of relevant services. According to R3, “since the State of Johor has declared a total ban on the use of polystyrene container, LAs can take this opportunity by becoming a supplier of biodegradable food containers to their food- based tenants”. Another effort is selling the set of apron and caps indirectly to tenants who apply for the license in food businesses (R8).
(vi) Balancing between the non-profit organization and the necessity to create sufficient income.
Within the traditional view, the main role of LAs is to provide public services and facilities and they are not profit-based organizations. However, this perspective becomes a constraint on Las in trying to expand their non-tax revenue extensively. While in a more modern view, R4 has emphasized that the LAs are encouraged to change their mentality with regards to being a corporate entity that is business minded. According to R10, LAs should move towards positive culture from “not possible” to “all possible”. Therefore, LAs has to balance between the traditional and modern view. As stated by R7, “we do not want to be the LA that is too poor yet not too rich because we are not an organization based on profit-oriented, but at the same time we cannot provide the services without gaining any returns”. To sum up, the ability of LAs to balance these depends on the leadership and cooperation from their stakeholders.
(vii) Methods to overcome unfavourable revenue sources.
LAs should keep only the profit-making property. Property that is less profitable can be disposed or sold (R9) so that LAs would not bear unnecessary maintenance cost.
While, according to R6, LAs could lessen the conditions on less-favoured property for rent to avoid vacancy of property for a long time.
(viii) Diversification of payment methods.
There are various methods and facilities provided by LAs for public convenience (R4, R10) such as council payment counter, payment kiosk, collection at the premises, local agencies such as post office, e-payment, credit card, banks (cash, cheque and ATM) and mobile app. While in MPPG, the public is allowed to make monthly instalment (R10). This method allows the public to settle any arrear periodically and is less burdensome to them.
To sum up, there are various approaches that can be taken to improve non-tax revenue. The ability to implement them relies heavily on the mentality of the decision-making group within LAs besides the approval from the state governments. Some of the LAs are advanced in the effort to diversify non-tax revenue while some are passive and rely heavily on property tax. However, if knowledge sharing on the raising non-tax revenue potential can be improved, it will indirectly encourage other passive LAs to act similarly.
5.0Conclusion
In conclusion, it is clear that property tax remains the main source of revenue to LAs in Malaysia. However, MBPP has begun diversifying its revenue from heavy reliance on the property tax. This is due to the fact that its average revenue from non-tax sources is 53.34 per cent. The strength of tax revenue is also supported by the trend analysis of CER which has proven that the property tax is a stable and predictable revenue source. While the CER of the non-tax revenue shows unpredictable values and trend making the reliance on tax revenue risky. However, on the positive side, the CER of non-tax revenue indicates that it is a flexible revenue. If LAs are working on a variety of effective strategies, non-tax revenue can be greatly improved.
Overall, the result of the in-depth interviews describes non-tax revenue as a growing source of LAs’ revenues and has become a significant concern to local authorities nowadays. This is because all respondents agree that non-tax revenue is a potential source of revenue to LAs but there are several challenges that prevent its growth such as the resources availability, the natural function of LAs as service providers and non- profit oriented organizations, the approval and policies set by the state governments, political intervention and leadership. Despite these issues, various strategies have been adopted by LAs in order to increase returns from non-tax revenue. The strategies include creation of more properties, exploration of new revenue sources, strengthening the monitoring and enforcement, knowledge sharing improvement, maximizing the exploitation of resource available, balancing between public benefit and the financial needs of LAs, retaining only profitable property and the diversification of payment mode.
There are two major contributions of this study. First, this study enriches the literatures on non-tax revenue since the amount of literatures that directly discusses non-tax revenue potential among Malaysian LAs is fairly limited. Secondly, the findings from trend analysis in this study provide a new insight that there are local authorities in Malaysia that have begun to diversify their revenue from relying heavily on property tax. This study has managed to prove that non-tax revenue is important and should be explored as much as property tax. For future work, it is suggested that the potential and strategies of non-tax income for each sub-category of non-tax revenues should be explored.
References
- Alm, J. (2013). A Convenient Truth: Property Taxes and Revenue Stability. Cityscape: A Journal of Policy Development and Research, 15(1), 243-245.
- Amborski, D. (2004). Application of Municipal User Charges in Canada, Experience and Implication for Other Jurisdiction, the 12th NISPAcee Annual Conference. Vilnius, Lithuania: Hotel Reval Lietuva.
- Atan, R. et al (2010). Financial Performance of Malaysian Local Authorities: A Trend Analysis. International Conference on Science and Social Research (CSSR). Kuala Lumpur, Malaysia: Seri Pacific Hotel.
- Ayupov, A. A. & Kazakovtseva, M.V. (2014). Management of Financial Stability of the Non-Tax Income of Regional Budgets. Procedia - Social and Behavioral Sciences. 131, 187-192.
- Braun, V. & Clarke, V. (2012). Thematic Analysis. In Cooper, H. (Vol. 2), APA Handbook of Research Methods in Psychology: Vol. 2. Research Designs. The American Psychological Association.
- Caroll, D. A. (2009). Diversifying Municipal Government Revenue Structures: Fiscal Illusion or Instability? Public Budgeting & Finance, 29: 27-48.
- Chen, G. (2017, July 28). Councils determined to recycle food waste. The Star Online. Retrieved from https://www.thestar.com.my.
- Collin, J. P., Léveillée, J., Rivard, M. & Robertson, M. (2003). Municipal Organization in Canada Tradition and Transformation, Varying From Province to Province. Institut de Ciències Polítiques i Socials (ICPS).
- Dubravka, J. A. (2007). Tackling the Problem of Inadequate Financing for Local Development: The case of Croatia in Sylvain Giguère (ed.). Local Innovations For Growth in Central and Eastern Europe, OECD Publishing.
- Fjeldstad et al (2003). Local Government Finances and Financial Management in Tanzania (21050). Bergen, Norway: Chr. Michelsen Institute (CMI).
- Germân, L. & Glass, E. (2016). Non-Tax Own-Source Municipal Revenues. (2nd Ed). Finance for Cities Leaders Handbook (pp 66-81). Nairobi, Kenya. United Nations Human Settlements Programme (UN-Habitat).
- Gideon, Z. & Alouis, C. (2013). The Challenges of Self-Financing in Local Authorities: The Case of Zimbabwe. International Journal of Humanities and Social Science. 3(11), 233-245.
- Hanis, M. B.,Trigunarsyah, B. & Susilawati, C. (2010). Elements of public asset management framework for local governments in developing countries. In: 8th International Conference on Construction and Real Estate Management (ICCREM), Brisbane, Australia: Royal on the Park Hotel.
- Hussain, A.A. & Brahim, M. (2006). Administrative Modernization in the Malaysian Local Government: A Study in Promoting Efficiency, Effectiveness and Productivity. Pertanika J. Soc. Sci. & Hum. 14(1), 51-62.
- Ibrahim, F. W. (2014), Local Public Goods and Citizen Satisfaction : A Case Study of District of Sik, Kedah, Malaysia. 5th Asia-Pacific Business Research Conference, Kuala Lumpur, Malaysia: Hotel Istana.
- Ibrahim, F. W. & Abd Karim. M. Z. (2004). Efficiency of Local Governments in Malaysia and Its Correlates. International Journal of Management Studies (IJMS), 11(1), 57-70.
- Januta, D. (1968). The Municipal Revenue Crisis: California Problems and Possibilities. California Law Revenue, 56(6), 1525-1558.
- Jolicoeur & Barret (2004). Coming of Age, Strategic Asset Management in the Municipal Sector. Journal of Facilities Management, 3(1), 41–52.
- Kaganova, O. & Nayyar-Stone, R. (2000). Municipal Real Property Asset Management: An Overview of World Experience, Trends and Financial Implication, Journal of Real Estate Portfolio Management, 6(4), 307-326.
- Malaysian Productivity Corporation, MPC (2016). Rationalising Revenue Raising-Business Licences (Local Government). A discussion paper prepared for Malaysian Productivity Corporation, MPC. Retrived from http://www.mpc.gov. my/smart-regulation/ on 9 July 2018, 11 am.
- Manganelli, B. & Tajani, F. (2013). Optimised Management for the Development of Extraordinary Public Properties. Journal of Property Investment & Finance. 32(2), 187-201.
- McMillan, M. & Dahlby, B. (2014). Do Local Governments Need Alternative Sources of Tax Revenue? An Assessment of the Options for Alberta Cities. SPP Research Paper. 7(26), 1-34.
- Ministry of Rural Development (2018). Basic Data Ministry of Rural Development. Retrived from http://www.rurallink.gov.my/en/citizen/desa-information/statistic/ on 4 March 2019, 10.00 am.
- Mohamed, N & Atan, R. (2006). Financial Performance of Local Authorities with Emphasis of Deficits. The Proceedings of International Conference on Local Government, Kota Kinabalu, Sabah.
- Mohamed, N., Mohd Yusof, M. H. & Ab Majid, R. (2013). The Presentation Formats of Malaysian Local Authorities’ Financial Statements. International Conference on Advanced Computer Science and Electronics Information (ICACSEI). Beijing, China.
- Mohd Talib, N. F., Mohd Ismail, R.A. & Adelabu, S. A. (2017). Transparency in Malaysia Local Government Administration. The Overview of Internally Generated Revenue (IGR). International Journal of Business and Management. 1(1), 22-27.
- Mosio, A. (2002). Essays on Finnish Municipal Finance and Intergovernmental Grant. Government Institute for Economic Research. ISSN: 0788-5008.
- Nakamura, K. & Tahira, M. (2008). Distribution of Population Density and the Cost of Local Public Services: The Case of Japanese Municipalities. Working Paper No. 231, Faculty of Economics, University of Toyama.
- Park, S. (2017). Local revenue structure under economic hardship: Reliance on alternative revenue sources in California counties, Local Government Studies, 43(4), 645-667.
- Rode, S. (2011). Challenge of Financing Physical Infrastructure and Services in Brihanmumbai Municipal Corporation. MPRA paper 20 30017, Retrieved from http://mpra.ub.uni-muenchen.de/30017/ at 24/10/2014.
- Salleh, D. & Siong, H. C. (2008). The Involvement of Private Sector in Local Infrastructure in Local Infrastructure Development in Malaysia. Jurnal Alam Bina. 11(1), 73-100. Shah Alam City Council (MBSA) Strategic Plan 2016-2020. Retrieved from http://www.mbsa.gov.my/
- Shirimia, L. & Rutamu, A. (2004). Alternative sources of revenues for financial sustainability, a case of local government in Rwanda. ARD Inc.
- Shoup, D. C. (2004). The Ideal Source of Local Public Revenue. Regional Science and Urban Economics. 34, 753-784.
- Singaravelloo, K. (2008). Local Government in Malaysia: Back to Basis and the Current Scene. Journal of Malaysian Chinese Studies. 11, 77-96.
- Slack, E. (1996). Financing Infrastructure: Evaluation of Existing Research and Information Gaps. Report prepared for Canada Mortgage and Housing Corporation.
- Solé-Ollé, A. & Hortas-Rico, M. (2010). Does urban sprawl increase the costs of providing local public services? Evidence from Spanish municipalities. Urban Studies 47, 1513–1540.
- Spearman, K. (2007). Financial Management for Local Government. (Volume 1). USA. Routledge, Taylor and Francis Group.
- Tayib, M. Coombs, H. M. & Ameen, J. R. M. (1999). Financial Reporting by Malaysian Local Authorities: A Study of the Need and Requirements of the Users of Local Authority Financial Accounts. The International Journal of Public Sector Management. 12(2), 103-120.
- Tschekalin, J. (2011). User fees: Moving Forward in Adjalan –Tosorontio. AMCTO. Vazquez. J. M. Mobilizing Financial Resources for Public Service Delivery and Urban Development. In: UN-HABITAT. The Challenge of Local Government Financing in Developing Countries. Kenya: United Nations Human Settlements Programme 2015. 14-33.
- Wales Audit Office (2016). Charging for services and generating income by local authorities. Auditor General of Wales. Cardiff.
- Warner, M. E. & Pratt, J. E. (2005). Spatial Diversity in Local Government Revenue Effort Under Decentralization: A Neural-Network Approach. Environment and Planning C: Government and Policy. 23, 657-677
- Wong, L. (2014). Enhancing Local Government Revenue Through Various Sources. Konvensyen PBT Sabah. Promenade Hotel, Kota Kinabalu. 21-22 Oktober. Retrieved from http://ww2.sabah.gov.my/mlgh/Lampiran/PPN_Increasing% Revenue.pdf on 4 November 2018, 12.30pm.
- Young et al (2018). A methodological guide to using and reporting on interviews in conservation science research. Methods in Ecology and Evolution; 9:10-19.