Profitability of Major Private Sector Companies Involved in The Private Finance Initiative Scheme
- Department of Accounting, Kulliyyah of Accounting and Management Sciences, International Islamic University Malaysia
Journal of Business Management and Accounting 1(1) (2011) · https://doi.org/10.32890/jbma2011.1.1.6792
Abstract
Private Finance Initiative (PFI) has become a widely used mechanism for delivering public services in the United Kingdom. Despite the extensive use of the PFI scheme and strong support from the private sector companies, it has often been controversial. One of the controversies is based on the claim that the private sector companies are making excessive profits from PFI projects. Hence, this paper aims at evaluating the profitability of several private sector companies which are heavily involved in the PFI projects. The analysis of the performance of private sector companies suggested that no clear evidence of excessive profits were made by the companies from their PFI involvement.
Keywords: Private finance initiative (PFI), profitability, private sector, performance
1Introduction
The Private Finance Initiative (PFI) is a means of using private finance and skills to provide public services which were traditionally provided by the public sector. Under PFI contracts, private sector companies carry out the responsibility and risk for the design, finance, project management and ongoing service quality and delivery throughout the contract period of normally 25 to 30 years. In return, the private companies will receive regular payments from the public sector to repay the costs of buildings and services provided. At the same time, companies also expect to earn an amount of profit as a reward for undertaking the risks.
As the early PFI projects are now up and running, some of the private companies have reported healthy profits from their involvement in the PFI. The Times dated 22 July 2003 highlighted that there are indications that some private builders make twice the profits from PFI projects compared with conventional procurement (The Times, 2003).
Later, The Guardian on 8 September 2003 reported that the construction companies engaged in the PFI are expected to make between three to ten times higher profit then they do on traditional contracts (The Guardian, 2003).
However, the extent to which private sector companies profit from PFI involvement has become a controversial issue. Those opposed to the PFI schemes criticised the private sector companies for making excessive profits from PFI schemes (UNISON, 2003a). For instance, Derek Simpson, a left-wing union official, claimed that;
‘PFI never works because it is based on those companies making profits. So public money is going into profits’ (The Times, 2002).
Also, at the Association of Teachers and Lecturers (ATL) 2004 Annual Conference in Bournemouth, Andy Ballard, ATL’s Somerset branch secretary also stated that:
‘Private companies charge excessively for financing the projects and insist on retaining operational and maintenance contracts to make a profit from them’ (Association of Teachers and Lecturers, 2004).
More importantly, a report from the House of Common Public Accounts Committee (2003) points out that insufficient information was available to verify whether profits made by private companies had actually reflected the risks undertaken in such schemes. In light of the above controversial scenario and its lack of evidence, this study attempts to further analyse the performance of private sector companies with greater attention on their profitability generated from PFI activities. Basically, it involves an in-depth analysis of the companies’ annual reports for the five year period from 1999 to 2003 by employing ratio analysis (i.e. profitability ratios) to evaluate the companies’ performance. The unique contribution of this paper is that it provides empirical evidence on the level of actual profit being earned by private sector companies from their involvement in PFI projects based on the financial analysis of the companies.
The remaining of this paper is structured as follows. Section 2 gives a literature review on private sector involvement in the public sector in the United Kingdom as well as involvement of private companies in the PFI projects. Then, Section 3 illustrates the methodology adopted in this study. Particularly, it provides background information on the companies covered in the analysis, profitability ratios used to analyse companies’ reporting performance and describes the analysis undertaken. Section 4 reports the details of results and findings on companies’ performance based on the availability of information in the annual reports. Section 5 discusses the limitations of the study and also offers suggestions for future research. Finally, Section 6 gives a conclusion of the study.
2Literature review
2.1Private sector involvement in the United Kingdom
The idea of the private sector assisting with the provision of public services is not new (Glaister, 1999). In the past, the private sector has always provided finance for public sector capital projects, such as roads and railways and has also undertaken the construction of the projects. Also, the private sector has been involved in providing other services to the government such as audit services, investment advice, legal advice and consultation for the construction projects. In recent years, governments worldwide have sought to encourage greater involvement of the private sector in delivering public services (Hood, 1995; Terry, 1996 and Rhodes, 1999).
In the UK, the general election in 1979, saw the increased encouragement of an established and on-going shift of activities away from the UK public sector towards a greater role for the private sector. Private sector involvement was principally aimed at improving the efficiency and quality of public services through the introduction of competition in the provision of public services. This was based on the belief that the private sector was more efficient and responsive to consumer needs as compared to the public sector (Horton and Farnham, 1999: 247; Broadbent and Laughlin, 2005). It was also aimed at breaking up the power of public sector monopolies by promoting competitive pressures in delivering public services (Hall, 1998; Horton and Farnham, 1999: 247). Also, the participation from the private sector was expected to reduce public expenditure (Lawton and Rose, 1994: 6). This section describes the development of the private sector role in providing public services in the UK after the general election in 1979.
Between 1979 and 1997, various policies which encouraged private sector involvement in the provision of public services were pursued in the UK. These included outright privatization of previously state-owned industries, contracting out of services to private firms, Compulsory Competitive Tendering (Boyne et al., 1999 and Pinch and Patterson, 2000) and the famous yet controversial scheme of Private Finance Initiative (PFI).
2.2Private finance initiative
PFI was officially launched in 1992 after the abandonment of the 1981 Ryries Rules and has attracted an even more substantial increase in the private sector involvement in delivering public sector projects (Heald, 1997; Hall, 1998 and Broadbent and Laughlin, 1999). Essentially, PFI represents a fundamental change in the focus of the public sector, away from being a direct provider of services and towards becoming a purchaser of services and a regulator. However, what makes PFI different from other initiatives is that, unlike privatisation, the public sector retains a substantial role in
PFI projects (i.e. as the main purchaser of services and as a regulator of the project). Also, unlike contracting out, the private sector provides the capital assets as well as the services (Kerr, 1998).
The key advantages of PFI over traditional public sector procurement are that PFI involves a substantial degree of risk transfer associated with constructing, operating and maintaining the assets to the private sector, provides an improved form of public procurement and offers better quality of public services with greater innovation in the design, which consequently could give better value for money from the use of public resources. However, it is criticised that PFI is often more expensive than publicly financed project due to higher borrowing costs incurred by the private sector. Furthermore, private sector companies are claimed to have been making excessive profits from PFI projects at the detriment of the benefits to be achieved from PFI projects (Terry, 1996; Heald, 1997; Jones and Pendlebury, 2000: 114; Broadbent et al., 2001; Audit Commission, 2003; Froud, 2003; UNISON, 2003 and Ratcliffe, 2004).
UNISON (2003) has scrutinized the issue of private sector companies making profits from PFI schemes. The study was aimed at explaining the different ways companies can expect to make profit from PFI. According to UNISON (2003), there are four main sources of profits which the private sector companies could earn from a PFI contract: 1) Profit from investment to run a PFI project; 2) Profit from construction; 3) Profits from contract to supply ongoing services; and 4) Profit from refinancing PFI projects. In addition, UNISON (2003) also evaluated the performance of ten of the biggest construction and facilities management companies involved in PFI by looking at each company’s turnover and profit figure. UNISON (2003) concluded that the ten companies consider PFI as a significant and growing part of the company’s operations and is providing a new and reliable source of profit.
Based on the idea from UNISON (2003), this study attempts to further analyse the performance of private sector companies with greater attention on their profitability generated from PFI activities. Unlike UNISON (2003) whose discussion was based on the actual turnover and profits figures, this present study employs ratio analysis (i.e. profitability ratios) to evaluate the companies’ performance. The proceeding section discusses in detail the methodology adopted in this study which include the selection of companies for analysis, the profitability ratios used and background information of the analysed companies.
3Research method
The study analyses the annual report of key private sector companies for five years from 1999 to 2003. In particular, the analysis covers ten major participants of PFI schemes whose names are constantly highlighted by the media. The ten companies are Amec,
Amey, Balfour Beatty, Carillion, Interserve, Jarvis, John Laing, Kier Group, Serco Group and WS Atkin. In fact, nine of these chosen companies were also the companies previously analysed by UNISON (2003a). Moreover, in an earlier study by UNISON (2003a), nine of these companies were considered to be the biggest construction and facilities management companies engaged in PFI.
Most of the annual reports of these companies, especially the reports for recent years, were obtained on-line from the individual company’s websites. Those reports which are not available on-line were obtained directly from the companies.
The study reviewed every single section of the annual reports and analysed both the financial and non-financial or descriptive information contained in the reports. As the study was primarily aimed at assessing the level of PFI profit made by the companies, greater attention was given to the analysis of financial statements. Analysis was carried out on the trend of the companies’ overall profitability as well as on the trend of the companies’ PFI profitability. Comparison was also made between profitability ratios of companies’ overall profits and the profitability ratios of the profits earned from PFI projects. Furthermore, the study also analysed the proportion of companies’ PFI profit to the overall profits generated by the companies.
Additionally, the non-financial or descriptive sections of the annual reports were also reviewed. The non-financial or descriptive sections of the annual reports typically consist of the operating review section, the Director’s report, the Financial Director reports and the Notes to Account. For the purpose of this study, the researcher extracted relevant information and important statements, views or opinions of the Director and Finance Executive on the current performance and future prospect of PFI contracts. This analysis supports the financial analysis of the companies’ profitability.
Profitability ratios measure the effectiveness of the management in generating profits from available resources. They can be used to discover the profitability trend of a company over time (i.e. time series analysis) or as the basis for an inter-company comparison. (Gibson and Boyer, 1979; Tyran, 123; Edwards, 2003: 241; Elliot and Elliot, 2004: 675-676 and Pendlebury and Groves, 2004: 119).
For the purpose of this study, profitability was measured using the key profitability ratios of return on capital employed (ROCE) and net profit margin. In this study, capital employed is defined as the net total assets, that is total assets (fixed assets plus current assets) less current liabilities. The reason for using net total assets is because the level of current assets is inextricably linked with the level of current liabilities. The amount of current assets and current liabilities are very much dependent on the working capital policy of the company. Therefore, in order to obtain more comparable assets bases and to minimise any distortions caused by variations in working capital, the netting off of current liabilities against current assets is applied (Pendlebury and Groves, 2004: 120).
In addition, as far as comparability is concerned, the capital employed figure ought to reflect the average amount of capital employed during the period since profit represents a flow of return generated throughout the year (Holmes et al., 2002: 121). Thus, the average of net total assets at the beginning and end of the period has been taken for the purpose of ROCE computation in this analysis.
For the profit figure, Lee (1983: 411-412), Gasking (1993: 30-31) and Pendlebury and Groves (2004: 124), claim that comparability will be improved by using a profit figure that reflects the sustainable ordinary trading activities and excludes the effect of any extraordinary and exceptional item. As a result, net profit before interest, taxation and exceptional items is applied. But, having net total assets as the capital employed figure, interest paid on current liabilities actually needs to be taken into account when calculating the profit. However, due to lack of information provided in the financial statement of the companies on the amount of short term interest paid, the adjustment for the short term interest has been ignored. In addition, since the study analyses the performance of the companies throughout the five year period from 1999 to 2003 it is essential to use the pre-tax profit figure in order to avoid the effect of changes in the tax rules from one year to another. In short, the ROCE used in this study is calculated as net profit before interest, taxation and exceptional items divided by the average of net total assets.
Net profit before interest, taxation and exceptional items ROCE * 100% Average net total assets
Another profitability measure used in this study is net profit margin. This is a useful ratio in its own right and focuses on the profits earned on sales generated. The net profit margin ratio is used in this study with the operating profit before interest, taxation and exceptional items used as the numerator of the ratio. The justification for this is similar to the justification for the use of ROCE as discussed earlier. In addition, net profit before interest is also used to prevent profit distortion by the different amounts of interest receivable or interest payable between companies (Lee, 1983: 411 and Palat, 1989: 9). The denominator for the net profit margin ratio is the value of the turnover. Thus, the formula applied for the profit margin ratio in this analysis is:
Net profit before interest, taxation and exceptional items Net profit margin * 100% Turnover
The next section presents the results of the analysis undertaken for the ten companies using these two profitability ratios. Profitability of Major Private Sector Companies Involved in the Private Finance Initiative Scheme: 17-39 23
4Results and findings
Basically, this section consists of two main parts. The first part presents the findings on the profitability of the companies’ overall activities. The second part, which is the primary focus of this part of the study, gives attention principally to the companies’ performance contributed by the PFI projects. Before proceeding with the results of profitability analysis undertaken, Table 1 below briefly provides background information on each individual company. These include the company’s principal activities or main divisions and the PFI sectors involved.
| COMPANY | PRINCIPAL ACTIVITIES | PFI SECTORS |
|---|---|---|
| Oil and gas Transport | Health Transport | |
| Amec | Infrastructure Industrial Regional Services Transport | Wastewater Home office Custodial Education Health |
| Amey | Business Process Outsourcing Ventures | Transport Defence Local government Building, Building Management & Services Education Civil & Specialist Engineering & Services Health |
| Balfour Beatty | Rail Engineering & Services Investment & Development Investment | Transport Energy and Wastewater Education Health |
| Carillion | Business Services Construction Services Infrastructure Services | Transport Home Office Security / Custodial Education Health |
| Jarvis | Accommodation Services System and Technology | Defence and security Transport Local Authority (continued) |
| COMPANY | PRINCIPAL ACTIVITIES | PFI SECTORS Transport / Railways |
| | Homes | |
| | Investments | Education |
| John Laing | Property development | Health |
| | Construction | Police |
| | Group Management | Defence |
| | Facilities management services | Education |
| | Industrial services | Health |
| Interserve | Project services | |
| | Equipment services | Custodial/ defence |
| | PFI Investment Construction and Services | Central government Education |
| Kier Group | Homes & Property Infrastructure Investment | Health Local government |
| | Civil Government | Health |
| | Defence | Defence |
| Serco Group | Industry & Commerce | |
| | Science | Transport |
| | Transport | Civil government Education |
| | Transport | |
| | Government services | Health |
| WS Atkins | Commercial services | Transport |
| | Industry | Custodial |
| | International | Local Authority |
4.1Overall activities performance of private sector companies
Based on the ROCE computation, using the pre-tax profit before interest, Table 2 reveals that the average performance of the ten companies showed a declining trend over the five year period.
| per cent (%) | ||||||
|---|---|---|---|---|---|---|
| 1999 | 2000 2001 | 2002 | 2003 | Average | ||
| Company | Pre-tax Profit before Interest | |||||
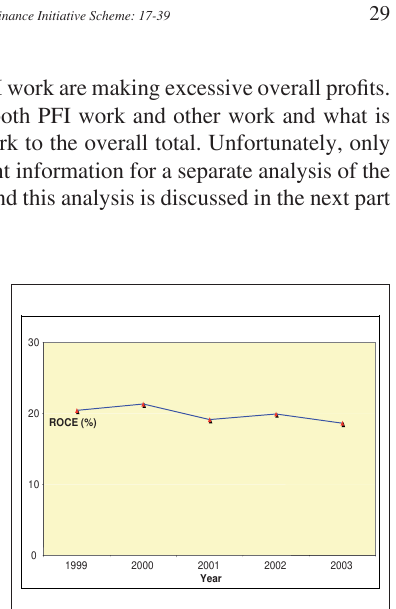
| Amec | 20.4 | 21.3 19.1 | 19.9 | 18.6 | 19.9 | |
| Amey* | 10.4 | 16.3 -0.9 | 3.7 | n.a | 7.4 | |
| Balfour Beatty | 26.2 1999 | 41.3 34.9 Profitability of Major Private Sector Companies Involved in the Private Finance Initiative Scheme: 17-39 | 30.1 2000 | 28.7 2001 | 32.2 (continued) 2002 | 25 per cent (%) 2003 Average |
| Company | Pre-tax Profit before Interest | |||||
| Carillion | 31 | 30.2 | 30 | 25.9 | 22.7 28 | |
| Interserve | 19.9 | 18 | 21.8 | 19.4 | 11.7 18.2 | |
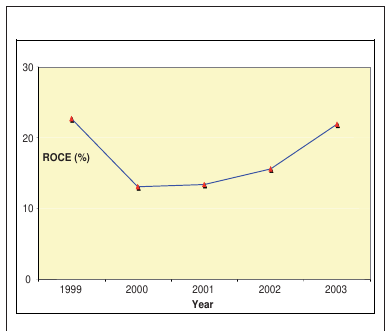
| Jarvis | 22.7 | 13.1 | 13.4 | 15.6 | 21.9 17.3 | |
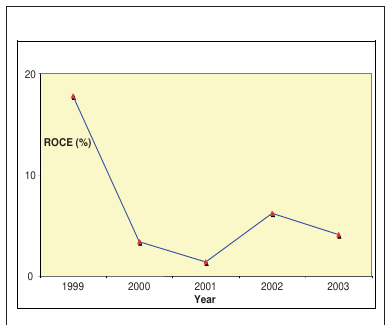
| John Laing | 17.8 | 3.4 | 1.4 | 6.2 | 4.1 6.6 | |
| Kier Group | 31.8 | 32 | 32.6 | 30.6 | 25.2 30.4 | |
| Serco Group | 20.3 | 26.3 | 14.6 | 16.6 | 7.6 17.1 | |
| WS Atkins | 34.2 | 25.8 | 21.8 | 18.9 | 7.6 21.7 | |
| Average | 23.5 | * the company has been taken over by Ferrovial Servicious and was no longer listed on the London Stock | 22.8 | 18.9 | 18.7 | 16.5 19.7 |
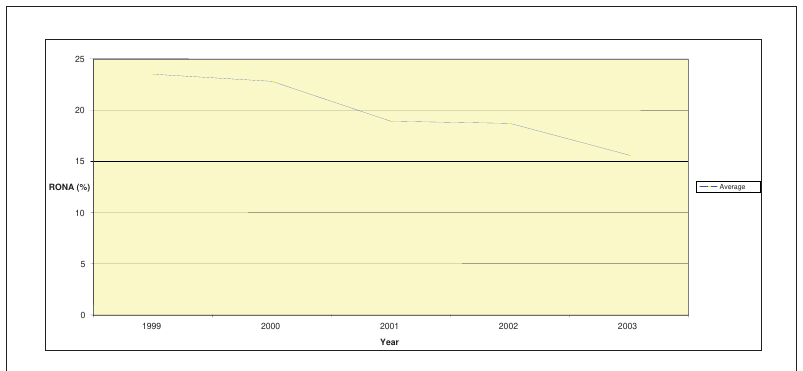
| Exchange since 26 June 2003. | decreased further to 16.5 per cent in 2003. | Figure 1 illustrates this falling trend of the average ROCE for the ten companies from 1999 to 2003. The average ROCE fell from 23.5 per cent in 1999 to 22.8 per cent in 2000 and to 18.9 per cent in 2001. This dropped slightly to 18.7 per cent in 2002 and | ||||
| RONA (%) | 1999 | 2000 | 2001 Year | 2002 | Average 2003 | |
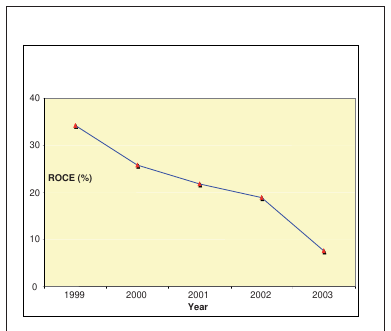
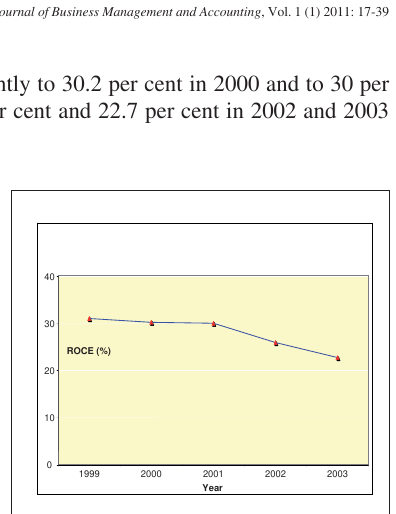
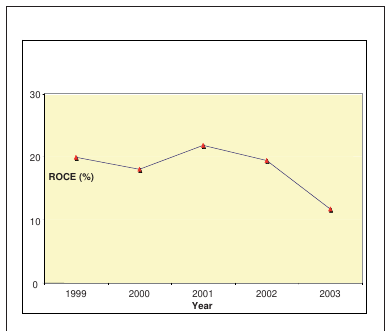

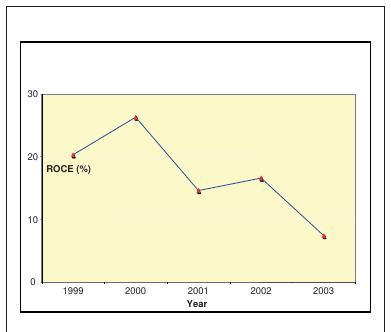
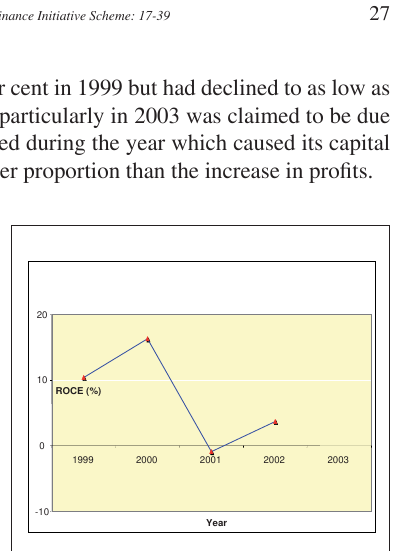
Similarly, Amey’s profitability ratio dropped drastically in 2001 as well as 2002 (Figure 7). As reported in the 2001 company’s annual report, several changes in its accounting policies especially with regard to the treatment of pre-contract costs after the introduction of UITF 34 resulted in poor results for the year ended 31 December 2001. Subsequently, when reporting the 2002 result, Sir Ian Robinson, the chairman of Amey, claims that:
‘…we suffered a number of setbacks, a number of which were completely outside our control. These included the continued delay to the disclosure of the London Underground PPP, disappointments in some of our larger investments, older construction project claims and a dramatic weakening of our cash position as bid costs recoveries that were anticipated did not materialise.’ (Amey plc - Chairman’s Statement, 2002).
As a recovery action, the company has sold part of its portfolio of investments in PFI special purpose companies to Laing Investment.
John Laing’s ROCE (Figure 8) was 17.8 per cent in 1999 and dropped to as low as 1.4 per cent in 2001. This was primarily due to heavy losses suffered by its construction business, Laing Construction. During the period, a few other structural changes also occurred. In 2002, the company undertook a strategic review of its business following the first major review in 2000. Subsequently, John Laing declared its intention to exit the housing market and its core business is now focused on the investment, development and operation of infrastructure projects in the UK and overseas. As a result, in 2002, its ROCE has increased to 6.2 per cent. However, during the financial year 2003, the company’s profitability dropped to 4.1 per cent.
ROCE (%) ROCE (%)
     0                                                     0
            1999     2000    2001    2002    2003                 1999      2000       2001        2002       2003
                             Year                                                      Year
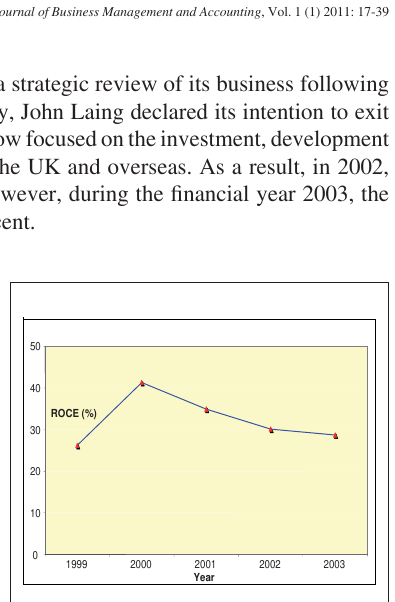
Throughout the five year period the ROCE of Balfour Beatty (Figure 9) has slightly increased from 26.2 per cent in 1999 to 28.7 per cent in 2003. However, from 2000 onwards, its ROCE has constantly decreased after a sharp rise during the year 2000. According to Balfour Beatty’s chairman, Viscount Weir, the company’s Board of Directors regrets that their decision to dispose of one of their main activities during the year severely hit the company’s performance in 1999. After a sharp increase in 2000 at 41.3 per cent, its ROCE fell to 34.9 per cent in 2001 to 30.1 per cent in 2002 and to 28.7 per cent in 2003.
On the other hand, over the period of analysis, both Jarvis (Figure 10) and Amec (Figure 11) seem to have performed almost constantly. This is especially true for Amec plc as indicated in Figure 11 above. For Jarvis, its ROCE has steadily increased since 2000.
This analysis of the companies’ overall ROCE for the five year period from 1999 to 2003 shows that there was a declining trend in the average performance and also a declining trend in the performance of most of the individual companies making up the average. The average ROCE for the ten companies over the five year period is 19.7 per cent, but by 2003 the average had fallen to 16.5 per cent. It would be difficult to conclude from Profitability of Major Private Sector Companies Involved in the Private Finance Initiative Scheme: 17-39 29 this that the main companies involved in PFI work are making excessive overall profits. However overall profitability is based on both PFI work and other work and what is really needed is the contribution of PFI work to the overall total. Unfortunately, only four of the ten companies provided sufficient information for a separate analysis of the profitability of PFI work to be undertaken and this analysis is discussed in the next part of this section.
20 20 ROCE (%) ROCE (%)
   0                                                                          0
            1999     2000        2001         2002        2003                       1999       2000       2001   2002   2003
                                 Year                                                                      Year
4.2PFI profitability of private sector companies
Out of the ten companies that were chosen for this analysis, only three companies; Balfour Beatty, Carillion and Interserve, disclosed sufficient financial information on their PFI involvement to permit the computation of ROCE and profit margin ratios for PFI activities. In addition, Amec disclosed information on turnover and net operating profit from PFI projects in the ‘Operating Review’ section of its annual reports and it was therefore possible to calculate a profit margin ratio for PFI work but not ROCE. In all four cases the information was available from 2000 onwards.
Based on the available information, the ROCE ratios for PFI activities have been calculated for the three companies; Balfour Beatty, Carillion and Interserve, and these are reported in Table 3, while the profit margin ratios and the proportions of PFI profit to each company’s overall profit have been computed for all four companies and are reported in Table 4. These ratios demonstrate the profitability that can be specifically attributed to the PFI activities of the companies. Figure 12 illustrates the trend of the average ROCE for PFI activities as compared to the average ROCE for the companies’ overall activities during the four year period from 2000 to 2003.
Average ROCE - Overall 25.0% activities
20.0% ROCE
10.0% Average ROCE - PFI activities
0.0% 2000 2001 2002 2003 Year
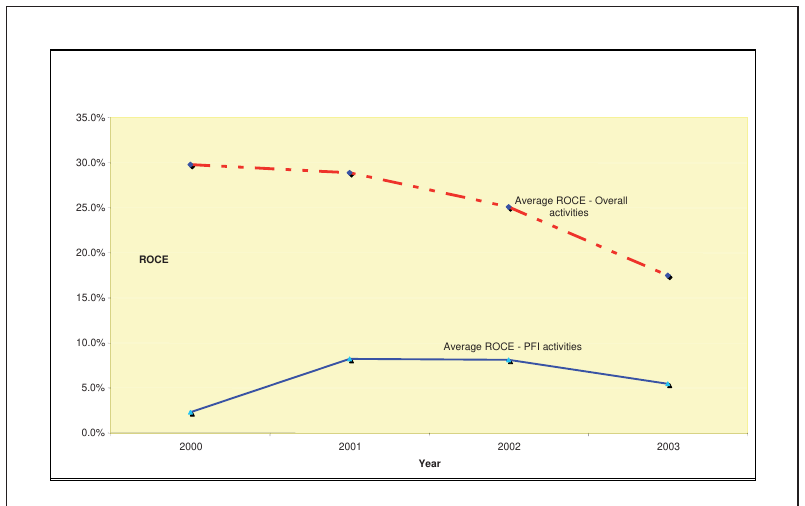
Based on Figure 12, the trend of the average ROCE for the overall activities of the three companies declined continuously throughout the four year period. In contrast, the companies’ average ROCE for PFI activities increased over the four year period from 2.3 per cent in 2000 to 5.6 per cent in 2003, having peaked at 8.2 per cent in 2001.
As also demonstrated in Figure 12, the companies’ average ROCE for PFI activities is significantly lower than the average ROCE for the companies’ overall activities. One possible explanation for this might be that because payments from the public sector will not be received until the projects become operational, there might be a lag between construction expenditure and the subsequent revenue stream received from the PFI projects, causing the reported profit in the early years of a project to be low or even non existent. Alternatively, the lower ROCE for PFI activities might simply indicate relatively low returns from PFI work as compared to profit generated from the other activities of the companies.
Table 3 provides a detailed result of the ROCE for PFI activities for the three companies. Over the four year period, the ROCE of Balfour Beatty increased, while it has been more or less constant for Carillion, and for Interserve it increased sharply in 2001 and has declined since then. Profitability of Major Private Sector Companies Involved in the Private Finance Initiative Scheme: 17-39 31
| per cent (%) | |||||
|---|---|---|---|---|---|
| Company | 2000 | 2001 | 2002 | 2003 | Average |
| Balfour Beatty | 5.1 | 7.0 | 7.1 | 6.4 | 6.4 |
| Carillion | 1.9 | 1.3 | 1.5 | 1.6 | 1.6 |
| Interserve | 0.0 | 16.4 | 15.7 | 8.7 | 10.2 |
| Average | 2.3 | 8.2 | 8.1 | 5.6 | 6.07 |
As shown in Table 3, Interserve has out-performed the other two companies in terms of the value of the ROCE. The company’s division which co-ordinates all of Interserve’s PFI activities is called PFI Investments and this division reported that there was an increase in its underlying operating profits of £2.4 million for 2002 as compared to only £1.9 million in 2001. The increase in the company’s absolute profit figure was claimed to have been achieved because more PFI projects reached the operational stage in 2002 (Interserve plc – Chairman’s Statement, 2002). At the same time, Interserve also continued to extend its PFI commitment by investing in several other new PFI contracts. Interserve’s involvement in PFI schemes covers various sectors including education, health, custodial and local accommodation (refer to Table 1). At the 2003 year end, the total value of Interserve’s PFI projects amounted to £35 million (20 projects). This has increased from the previous year’s investment which amounted to £29 million (15 secured PFI projects).
Throughout the period of analysis, Balfour Beatty also reported a positive outcome from PFI projects as shown in Table 3. Its ROCE increased from 5.1 per cent in 2000 to 6.4 per cent in 2003. Basically, its involvement in PFI covers construction work, service provision and equity or loan investment. As at 31 March 2004, Balfour Beatty had successfully secured 16 PFI projects from various sectors including health, roads, education, transport, energy and wastewater (refer to Table 1).The investment commitment required by Balfour Beatty for these projects is £180 million (Balfour Beatty plc – Financial Review, 2003). Balfour Beatty’s PFI projects have also received numerous awards. These include: 1. Stoke School, RoSPA Silver Award for Occupational Safety in May 2003; 2. Stoke School, Best Operational Project above £20m at PFI Awards in May 2002; 3. University College London Hospital, Best Health Project above £20m in PFI Report, June 2002; 4. Seeboard Powerlink, RoSPA Silver Award & British Safety Council Award, December 2000 (Balfour Beatty, 2003).
Even though the ROCE for PFI activities of Carillion was found to have been more or less constant throughout the four years (refer to Table 3), the company reported that its absolute profit figure from PFI investment increased by 40 per cent in 2003. The increase in profit was mainly earned from the refinancing of the Darent Valley hospital and also from payments from the newly operating Government Communications Headquarters in June 2003 (Carillion plc – Chief Executive Review, 2003: 4).
Overall, the analysis of companies’ ROCE for PFI activities throughout the four year period shows that the profitability varied between companies. More importantly, even though the average ROCE for PFI activities increased over analysis period, this still represented a relatively small proportion of the overall average ROCE.
Because Amec did not provide information on the capital employed on PFI activities it could not be included in the ROCE analysis. However, AMEC did report separately its turnover and profit on PFI activities, as did the other three companies, and so a profit margin analysis of PFI activities was undertaken for all four companies.
Table 4 demonstrates the PFI profit margin of the four companies from 2000 to 2003. Overall, the average PFI profit margin of the four companies had decreased over the four year period. In 2000, the average profit margin was 30.8 per cent and by 2003 it had declined to 19.4 per cent. Furthermore, three of the four companies experienced a decline in their net profit margin over the four year period. The exception was Interserve which saw its profit margin increase from 0 per cent in 2000 to 7.7 per cent in 2003.
| per cent (%) | |||||
|---|---|---|---|---|---|
| Company | 2000 | 2001 | 2002 | 2003 | Average |
| Amec | 43.0 | 14.8 | 19.0 | 26.2 | 25.8 |
| Balfour Beatty | 61.0 | 52.2 | 50.0 | 31.0 | 48.6 |
| Carillion | 19.0 | 12.5 | 12.7 | 12.6 | 14.2 |
| Interserve | 0.0 | 8.3 | 10.1 | 7.7 | 6.5 |
| Average | 30.8 | 22.0 Amec’s high profit margin in 2000 resulted from repayments received on two PFI projects which started operation during the year (i.e. Cumberland Infirmary and Inland Revenue Longbenton Estate) and from the recovery of bid costs on three projects which had reached financial close during the year. The years 2002 and 2003 benefited | 23.0 Profitability of Major Private Sector Companies Involved in the Private Finance Initiative Scheme: 17-39 | 19.4 | 23.8 33 |
from the recovery of bidding costs and also the capitalisation of pre-contract costs which resulted from complying with the UITF 34 requirements (Amec plc – Segmental Review 2002). The lower profit margin in 2001 was due to the lack of projects being brought to financial close during the year.
The profit margin of Balfour Beatty declined constantly over the four year period. However, the underlying profits from Balfour Beatty’s PFI projects increased over the period. The pre-tax profit before interest on PFI work was £25 million in 2000, this increased to £36 million in 2001, £40 million in 2002 and then to £54 million in 2003. The PFI profit margin of Carillion declined from its 19 per cent level in 2000 and then remained more or less constant at around 12.5 per cent for the next three years.
As a further attempt to analyse the level of profitability from PFI projects, the proportion of the PFI profit to the overall companies’ profit has been computed. The average proportion of PFI profit to the overall profit for the four companies throughout the four year period is illustrated in Figure 13, while the analysis for each individual company is presented in Figure 14.
As shown in Figure 13, over the four year period the average proportion of the PFI profit to the overall profit for the four companies rose steadily from 9.8 per cent in 2000 to 11.7 per cent in 2001 to 13.9 per cent in 2002 and to 16.5 per cent in 2003. This represents an increase of approximately 19 per cent each year.
25 22.5 Proportion (%)
                                                                                                                            6.7
                                         5.8                                                                                                    5.6
                                                                                                    4.9               4.5
                                                                   3.4                 3.2
                                               2000                      2001                             2002                    2003
                                                                                             Year
Amec Balfour Beatty Carillion Interserve
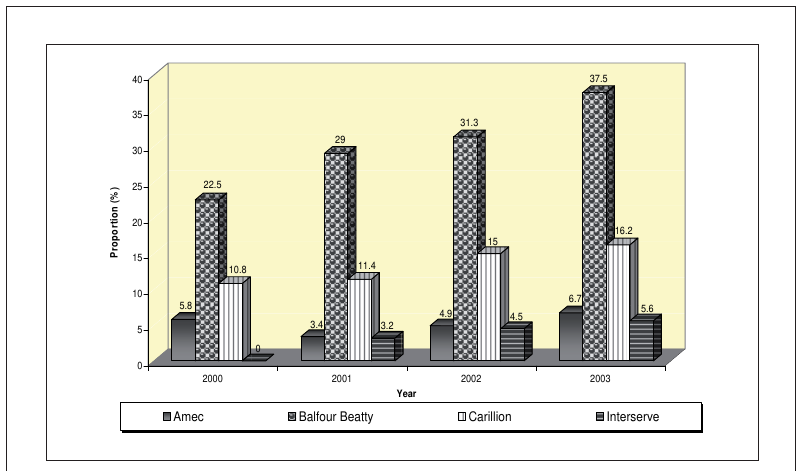
Likewise, the analysis for each individual company also indicates that the proportion of PFI profit to overall profit increased throughout the period. It is also clear that Balfour Beatty had the greatest proportion of PFI profit to the overall profit throughout the four years. Its average proportion during the four year period as shown in Figure 14 was 30.1 per cent. The huge contribution of PFI profit to the company is acknowledged by Mike Welton, the chief executive, who claimed that:
‘In the 12 months to the end of 2003, our order book grew by 14 per cent. The principal contributory factor was conversion of six PPP/PFI concessions from preferred bidder to financial and contractual close’ (Balfour Beatty plc – Chief Executive’ Review, 2003: 19)
Interserve had the lowest proportion of PFI profit to overall profit and its average proportion over the four year period was only 3.3 per cent (Figure 14).
35.0 Proportion (%) 30.1 30.0
0.0 Amec Balfour Beatty Carillion Interserve
Company
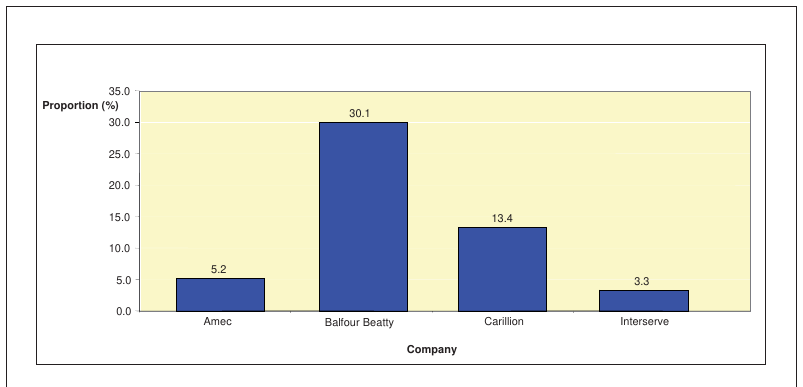
The analysis of PFI profitability reveals a wide range over the companies involved. The four years average ROCE for three of the companies ranges from 1.6 per cent to 10.2 per cent (refer to Table 3). Also, the individual company’s average net profit margins varies between 6.5 per cent and 48.6 per cent (refer to Table 4). Finally, as shown in 20.0
Figure 14 above, the companies’ average proportion of PFI profit to the overall profits 15.0 for the four year period ranges from 3.3 per cent to 30.1 per cent.
There are several possible explanations for the variation in PFI contribution between the companies. One of the reasons for the differences might be because of the different nature of PFI works engaged in by the companies. According to UNISON (2003a), construction work is not the most lucrative part of a PFI deal as compared to profits received if companies are involved as equity holders in private sector consortiums which often established to run PFI projects or returns made from service provision. This is supported by Bill Tallis, the director of the Major Contractors Group (MCG), who reported that margins obtained from PFI construction is normally between 7.5 per cent and fifteen per cent, while the returns on equity investment in PFI projects is expected to be between 10 per cent and 20 per cent (The Guardian, 2003).
Another reason could be due to differences in the time lag between construction expenditure and the subsequent revenue streams accruing to each company. As companies only receive payments once the projects are up and running, a company with a greater number of operational PFI projects might be expected to report higher profits. Finally, the variation might simply be due to the different level of involvement in PFI projects by different companies.
The analysis reveals that the average ROCE for PFI activities and the proportion of PFI profits to overall profits indicate an increasing trend, while the average profit margin for PFI activities shows a declining trend throughout the four year period. However, there is a wide range between companies in the contribution of PFI activities to ROCE, profit margins and the proportion of PFI profit to overall profit.
5Limitations and suggestion for future research
There are several limitations inherent in this study that should be pointed out in order to ensure a fair interpretation of the results. One of the limitations is that in assessing the extent of the private sector companies’ profitability from the PFI activities, the sample size analysed was fairly small. Although ten major PFI construction and facilities management companies have been selected, the analysis on PFI financial performance was based on only three to four companies. The findings on companies’ PFI financial performance were also limited as analysis was mainly based on the information disclosed in the annual reports. In order to obtain rigorous conclusions on the extent to which companies’ profits generated from PFI activities, an analysis which covered greater sample of private sector companies and using several methods of performance assessment could be undertaken in the future. However, with due consideration to these limitations, the evidence offered in this paper on the profitability of key private sector players in the PFI scheme may to some extent contribute to the controversial debates over the benefits and cost of the PFI scheme.
6Conclusion
Under PFI schemes, the opponents of PFI have also consistently blamed the private sector consortiums for securing higher quality earnings from construction, service provision and from their equity holdings in a consortium. It was argued that the unreasonable amount of profits earned had eliminated the value for money expected from a project. This study evaluated the extent of private sector companies’ profit generated from PFI projects using ratio analysis based on information disclosed in the annual reports.
Results reveal that the average ROCE of the companies’ overall activities had a declining trend throughout the five year period from 1999 to 2003. In terms of the profitability contributed mainly by PFI projects, the companies’ average ROCE demonstrated an increasing trend during the four year period from 2000 to 2003. However, the companies’ average PFI net profit margin was seen to have been decreasing throughout the period. Using these ratios, the individual companies’ results were found to be variable.
A further analysis in terms of the proportion of PFI profit to companies’ overall profits reveals an upward trend during the four year period, even though the value is relatively small. Furthermore, analysis also reveals that there is a massive range of results between companies for each ratio used. This could possibly be due to lag between construction expenditure and the subsequent revenue stream or a significantly low profit achieved from PFI projects as compared to other activities. Despite the lack of firm evidence about the existence of superior earnings from PFI activities, a thorough review of descriptive sections of the annual reports acknowledges that all companies were positive and optimistic about their involvement in PFI schemes and the expected future returns from the PFI projects.
The overall results of the profitability analysis undertaken reveals no clear evidence to support the claim made by the opponents of PFI schemes that private sector companies have earned excessive profit from their involvement in PFI schemes. In fact, the profits made by the companies could be considered as a reasonable reward for the risks undertaken and the services provided. Nonetheless, the reliability of the results from the profitability analysis carried out in this study is highly dependent on the extent to which financial information disclosed in the annual reports is free from any accounting manipulation.
The analysis of the private sector companies’ profitability from PFI activities also shows inconsistent results between companies throughout the period of analysis. Based on the available information from the companies’ annual reports, the level of profit made by the companies from their involvement in PFI schemes seems to be reasonable, given the level of risks that the private sector companies had undertaken and the quality of the services provided. In other words, available evidence could not fully justify the accusation that private sector companies had been making unnecessary huge profit from the PFI projects at the detriment of the value for money expected to be delivered by the facilities and services provided.
References
- Amec plc. Annual Reports. 1999–2003. Amey plc. Annual Reports. 1999–2003.
- Association of Teachers and Lecturers (2004) ATL Conference to Debate PFI. April 2004. Association of Teachers and Lecturers: London
- Audit Commission (2003) PFI in Schools. Audit Commission: London.
- Balfour Beatty (2003) Balfour Beatty as a PPP/PFI Contractor. [WWW] URL http://balfourbeattyppp.com (Accessed 31 October 2003). Balfour Beatty plc. Annual Reports. 1999–2003.
- Boyne, G.A., Gould-Williams, J., Law, J. and Walker, R. (1999) ‘Competitive Tendering and Best Value In Local Government’ Public Money and Management. 19 (4), 23-30.
- Broadbent, J. and Laughlin, R. (1999) ‘The Private Finance Initiative: Clarification for a Future Research Agenda’. Financial Accountability & Management. 15 (2), 95-114.
- Broadbent J., Haslam, C. and Laughlin, R. (2001) The Origins and the Operation of the PFI. [WWW] URL:http://www.ippr.org.uk/research/ (Accessed 12 January 2003). Carillion plc. Annual Reports. 1999–2003.
- Edwards, J.R. (2003) ICSA Professional Development: Financial Accounting. ICSA Publishing Ltd: London.
- Elliot, B. and Elliot, J. (2004) Financial Accounting and Reporting (8th ed.). Prentice Hall Financial Times: London.
- Froud, J. (2003) ‘The Private Finance Initiative: Risk, Uncertainty and the State’. Accounting, Organizations and Society. Vol. 28 (6), 567-589.
- Gasking, T. (1993) Perfect Financial Ratio: All You Need to Get it Right First Time. Century Business: London.
- Gibson, C.H. and Boyer, P.A. (1979) Financial Statement Analysis. CBI Publishing Company: Massachusetts.
- Glaister, S. (1999) ‘Past Abuses and Future Uses of Private Finance and Public Private Partnerships in Transport’. Public Money & Management. July-Dec. 1999. 29-36.
- Hall, J. (1998) ‘Private Opportunity, Public Benefit?’ Fiscal Studies. 19 (2), 121-140.
- Heald, D. (1997) ‘Privately Financed Capital in Public Services’. The Manchester School. LXV (5).
- Holmes, G. and Sugden, A. and Gee, P. (2002) Interpreting Company Reports and Accounts (8th ed.).Prentice Hall: London
- Hood, C. (1995) ‘The ‘New Public Management’ in the 1980s: Variation on a Theme’. Accounting, Organizations & Society. 20 (2/3), 93-109.
- Horton, S. and Farnham, D. (1999) ‘New Labour and the Management of Public Services: Legacies, Impact and Prospects’. In Horton, S. and Farnham, D. (eds) Public Management in Britain. Palgrave: New York.
- Horton, S. and Farnham, D. (1999) (eds) Public Management in Britain. Palgrave Publishers Ltd: New York.
- House of Common Public Accounts Committee (2003) Delivering Better Value For Money from Private Finance Initiative Contracts. Public Accounts Committee Twenty-eighth Report. House of Common: London. Interserve plc. Annual Reports. 1999–2003. Jarvis plc. Annual Reports. 1999–2003. John Laing plc. Annual Reports. 1999–2003.
- Jones, R. and Pendlebury, M. (2000) Public Sector Accounting. 5th ed. Financial Times Prentice Hall: England.
- Kerr, D. (1998) ‘The Private Finance Initiative and the Changing Governance of the Built Environment’. Urban Studies. 35 (12), 2277-2301. Kier Group plc. Annual Reports. 1999–2003.
- Lee, G.A. (1983) Modern Financial Accounting. (3rd. ed.) Van Nostrand Reinhold (UK) Co. Ltd.: Wokingham.
- Palat, R. (1989) Understanding Ratios: A Practical Guide for Business, Finance and Banking. Kogan Page: London.
- Pendlebury, M.W. and Groves, R. (2004) Company Accounts: Analysis, Interpretation and Understanding (6th ed.) Thomson: London.
- Pinch, P.L. and Patterson, A. (2000) ‘Public Sector Restructuring and Regional Development: The Impact of Compulsory Competitive Tendering in the UK’. Regional Studies Association. 43 (3), 265-275.
- Ratcliffe, A. (2004) ‘The Real Benefit of PFI’. Public Money & Management. June 2004. 134-135.
- Rhodes, R.A.W (1999) ‘Traditions and Public Sector Reform: Comparing Britain and Denmark’. Scandinavian Political Studies. 22 (4), 341-370.
- Serco Group plc. (2002) Our Approach to PFIs. Issue 2. September 2002. [WWW] URL:http://www.serco.com (Accessed 15 April 2003). Serco Group plc. Annual Reports. 1999–2003.
- Terry, F. (1996) ‘The Private Finance Initiative-Overdue Reform or Policy Breakthrough?’ Public Money & Management. Jan-Mar 1996. 9-16.
- The Guardian (2003) ‘PFI Triples Profits, say Firms’. The Guardian. 8 September 2003.
- The Times (2002) ‘One Man’s Rage Against the Machine’. The Times. 26 July 2002.
- The Times (2003)’ Private Builders ‘Double their Profits with PFI’; Pubic Policy’. The Times. 22 July 2003.
- UNISON (2003a) Profiting from PFI. 1 February 2003. UNISON: London.
- UNISON (2003b) The PFI Experience: Voices from the Frontline.1 March 2003. UNISON: London.
- UNISON (2004) Public Risk for Private Gain? - The Public Audit Implications of Risk Transfer and Private Finance. UNISON: London.
- WS Atkins plc. Annual Reports. 1999–2003.