AI Narrative Localization and Sectoral Co-Movement in Malaysia
- Institute for Mathematical Research (INSPEM), Universiti Putra Malaysia
- School of Business and Economics, Universiti Putra Malaysia
Journal of Business Management and Accounting 16(2) (2026) · https://doi.org/10.32890/jbma2026.16.2.5
Abstract
Global technology narratives do not become locally price-relevant in smaller emerging markets in a uniform way. Evidence from Malaysian equity linkages shows that artificial intelligence ( AI) narrative localization is selective rather than broad-based. Global technology sentiment alone does not uniformly reshape domestic sectoral co-movement. The strongest and most robust post-break evidence appears in the technology–utilities linkage, identifying the compute–power nexus as the main channel through which AI-related attention became visible in Malaysian market linkages. Property/REIT-related linkages move in the expected direction, but they remain weaker under conservative inference and more sensitive to proxy construction. These findings indicate that AI narrative localization depends on concrete domestic implementation constraints rather than generic thematic exposure. The paper contributes to narrative economics and investor-attention research by documenting the boundary conditions under which a global technology story becomes observable in local equity pricing.
Keywords: Artificial intelligence, narrative localization, sectoral co-movement, infrastructure, emerging markets, Malaysia.
INTRODUCTION
Artificial intelligence (AI) has become pervasive in market commentary, but visibility alone says little about its domestic pricing relevance. The more difficult question is how a global technology narrative becomes economically meaningful in a smaller emerging market. Malaysia is a useful case because the issue is not simply whether investors noticed the global AI story, but when that story became locally relevant enough to alter domestic sectoral co-movement. We argue that global attention alone is not sufficient. Financial narratives can shape expectations and redirect investor attention, and once a theme becomes salient enough, it can influence how related assets are read and priced (Nyman et al., 2021; Shiller, 2017). Still, in a market like Malaysia, a global technology narrative does not automatically reorganize domestic pricing. It needs a local anchor. Without that, the connection between an external AI cycle and domestic sector returns is likely to remain partial, unstable, or episodic. That local anchor became much clearer during 2024. Microsoft’s announcement on 2 May 2024 mattered not only because of the US$2.2 billion figure, but because it linked AI to cloud infrastructure, skills development, cybersecurity capacity, and a proposed national AI Centre of Excellence (Microsoft, 2024). Google’s move later that month made the story even more concrete. Its US$2 billion commitment involved Malaysia’s first Google data centre and Google Cloud region, and the project was publicly tied to Elmina Business Park as well as Malaysia’s Cloud First Policy (Google, 2024). By September 2024, the Ministry of Science, Technology and Innovation (MOSTI, 2024) had also released Malaysia’s National Guidelines on AI Governance and Ethics. At that point, AI was no longer just a foreign technology theme being observed from a distance. It had started to take institutional and infrastructural form inside Malaysia. These events provide the economic motivation for the baseline break date, while the revised analysis further tests this timing through alternative break dates and wider event-window checks. This matters for pricing. If AI had remained mostly an imported sentiment story, the strongest adjustment should have appeared mainly through co-movement with foreign AI-sensitive assets. That is only part of the picture. We are more interested in what happened inside the Malaysian market itself. Once AI is interpreted through data centres, cloud capacity, electricity demand, and site development, the relationships among technology, utilities, and property-related sectors should begin to look different. That possibility is economically plausible. Data centres are digital assets, but they are also physical and infrastructure-intensive investments. They need land, electricity, cooling systems, and long-horizon capacity expansion. From that perspective, stronger co-movement among technology, utilities, and property does not look incidental. It looks structural. Marzuki and Newell (2019) make this point from the property side, and the broader infrastructure logic points in the same direction. This framing is also consistent with the present study’s emphasis on data centres as the point where digital infrastructure, power capacity, and real-asset development intersect. The revised evidence points to a more selective interpretation. External AI-sensitive assets remain relevant, but the strongest and most robust post-break evidence appears inside the domestic technology– utilities linkage. This pattern is consistent with the idea that AI became more locally interpretable once it was connected to compute capacity, electricity demand, and data-centre deployment. The property/REIT-related linkages move in the same expected direction, but they are treated more cautiously because the HAC-adjusted regression evidence is weaker. The paper therefore does not argue that AI localization caused broad sectoral repricing. It examines whether the post-break period is associated with stronger domestic co-movement in sectors most exposed to the local implementation of AI infrastructure.
This narrower interpretation is important for the contribution of the study. In a smaller emerging market, a global technology narrative may not immediately translate into domestic market structure. It becomes easier to observe when investors can connect the narrative to local assets, firms, and infrastructure constraints. For Malaysia, the clearest channel is the compute–power relationship represented by the technology–utilities linkage, while the wider compute, power, and land channel remains suggestive rather than conclusive. The contribution of the paper is therefore to show how narrative localization can be studied through domestic sector co-movement, while keeping the empirical interpretation cautious and association based.
LITERATURE REVIEW AND HYPOTHESES DEVELOPMENT Narrative Finance, Attention, and Nonlinear Repricing Financial markets do not absorb new themes through fundamentals alone. They also absorb them through stories. Shiller (2017) treats narratives as economically consequential once they spread widely enough to shape expectations, while Nyman et al. (2021) show that financial narratives move with broader system-level dynamics rather than remaining peripheral commentary. The point is not merely that investors discuss a theme, but that the theme changes which signals appear relevant and how those signals are interpreted. This helps explain why repricing may be uneven. Hong and Stein (1999) show that when information diffuses gradually, price adjustment need not be immediate, while Barberis et al. (1998) demonstrate that belief revision can generate overreaction or underreaction. In the AI setting, that older logic has become more concrete. Recent evidence suggests that generative AI is already affecting investor trading behaviour and information processing (Cheng et al., 2025), while AI-related information environments may also influence stock price synchronicity and market efficiency (Saif-Alyousfi, 2025). AI-related pricing, then, should not be expected to evolve in a smooth and constant way across markets. It may strengthen only when the narrative becomes meaningful in a particular domestic setting. Global Spillovers and the Localization Constraint Much of the emerging discussion still treats AI-related pricing through a spillover lens. In that view, enthusiasm begins with major technology firms or benchmark indices and then travels outward. That channel is plausible, but for a smaller emerging market it is incomplete. A global story still has to become locally interpretable before it can reorganize domestic pricing. Malaysia is useful in this respect. The country already had a credible electronics and semiconductor base before the current AI wave intensified. Bank Negara Malaysia (2024) notes Malaysia’s established role in the global E&E value chain, particularly in assembly, testing, and packaging. Yet industrial exposure alone does not explain repricing. Merton’s (1987) incomplete-information framework is helpful here because it suggests that assets are not priced in the same way when recognition and information sets remain uneven. Localization can be understood in similar terms: a previously external narrative becomes easier for domestic investors to recognize, map, and price. That process became much more visible during 2024. Microsoft (2024) announced a US$2.2 billion investment linked to Malaysia’s cloud and AI transformation. Google (2024) followed with a US$2 billion commitment tied to its first Malaysian data centre and Google Cloud region. MOSTI (2024) then introduced the National Guidelines on Artificial Intelligence Governance and Ethics. These events moved AI away from abstract global excitement and closer to domestic implementation. Recent Malaysia-focused work fits that reading. Leong and Freeman (2024) emphasize policy response and governance, while Lada et al. (2023) and Enshassi et al. (2025) show that AI adoption depends on readiness, commitment, and perceived usefulness. Keith (2024) and Walter (2024) make the same point more broadly: AI governance depends not only on ambition, but also on whether institutions can convert aspiration into workable arrangements. Localization, in that sense, is the missing step between global attention and domestic pricing. In this paper, narrative localization refers to the point at which an external AI theme becomes easier for domestic investors to map onto local firms, sectors, and infrastructure constraints. Global attention alone is unlikely to produce sectoral repricing unless investors can connect the narrative to visible implementation channels, such as cloud infrastructure, data centre investment, electricity demand, and site-based capacity. Recent JBMA evidence on Malaysian listed-firm strategy also points to growing attention to digital innovation and AI capabilities, although it should be read as firm-strategy context rather than direct capital-market evidence (Nashraa et al., 2026). This study extends that logic to market co-movement by examining whether AI localization is reflected in stronger linkages among implementation-related domestic sectors. Infrastructure Logic and Domestic Linkage Reordering Once AI is tied to domestic implementation, it stops looking like a narrow technology story and starts to look like infrastructure. Data centres are not purely digital assets. They require land, buildings, grid access, cooling systems, and reliable electricity. Marzuki and Newell (2019) already identified data centres as a distinct technology-oriented property segment. The property/REIT channel is also relevant because Malaysian REIT performance is linked to firm-level financial and return-related determinants (Sulaiman et al., 2023). This does not provide direct evidence on AI narratives, but it supports treating property-linked listed vehicles as a possible market channel when AI-related investment becomes connected to site-based infrastructure demand. The energy side makes the same point more sharply. The International Energy Agency (2025) projects a substantial rise in data-centre electricity demand through 2030, with AI identified as a major driver. Peng et al. (2023) show that digital development can also produce rebound effects in energy use rather than automatically reducing pressure. Recent work on data-centre energy systems reaches a similar conclusion from a more applied angle, showing that large-scale digital infrastructure must increasingly be read alongside power-system capacity and design (Takci et al., 2025; Wang, 2025). AI deployment, in other words, carries a physical footprint. That has direct implications for sectoral repricing. If AI becomes economically meaningful through implementation rather than rhetoric alone, the post-localization adjustment should not be evenly distributed across the market. It should be concentrated in the sectors closest to compute, electricity, and site-based capacity. In Malaysia, that points most clearly to technology, utilities, and property or REIT-related counters. Recent investment reporting by the Malaysian Investment Development Authority (MIDA, 2025) is consistent with this reading, as data centre and cloud-related projects are increasingly framed as a central part of Malaysia’s digital investment landscape.
Hypotheses Development
Our first hypothesis starts from a simple mismatch. If AI optimism is mostly external, why should Malaysian technology stocks react in a stable way at all? Earlier work on narratives and attention suggests that stories can shape expectations and market responses (Nyman et al., 2021; Shiller, 2017), while older finance theory reminds us that information does not diffuse instantly or uniformly (Hong & Stein, 1999). More recent evidence shows that AI can directly affect information processing in financial markets (Cheng et al., 2025). What we expect, then, is a regime-dependent rather than constant exposure effect. Before localization, the mapping from global AI proxies to Malaysian technology should remain weak or episodic. After localization, it should become stronger. H1: The synchronization between global AI proxies and the Malaysian technology sector is expected to be regime-dependent, with stronger co-movement more likely to appear after the AI narrative becomes locally anchored. The second hypothesis follows the same logic at the domestic level. Once AI begins to matter locally, repricing should not stop at the sector most visibly associated with technology. A narrative that acquires a credible implementation frame is likely to spill across connected domestic sectors as investors link AI to a wider economic structure. Incomplete and selective attention may delay that process at first, but it should become more visible once the local anchor is in place (Merton, 1987; Saif-Alyousfi, 2025). H2: Domestic sectoral linkages in Malaysia are expected to be stronger in the post-break period than in the pre-break period, although this evidence is interpreted as association-based rather than causal. The third hypothesis is narrower and more revealing. If the localization story is really about implementation, then the strongest post-break adjustment should not appear everywhere. It should show up most clearly where compute capacity, electricity demand, and site-based development intersect. Older work on selective belief revision already implies that market responses need not be evenly distributed across assets (Barberis et al., 1998). In the present setting, that concentration points to the technology, utilities, and property or REIT nexus. H3: Post-break domestic co-movement is expected to be most visible in the technology–utilities linkage, with property/REIT-related linkages providing additional but potentially weaker evidence of the compute, power, and land channel.
METHODOLOGY Data and Variable Construction This study uses an event-anchored transition design rather than a conventional short-window event study. Following MacKinlay’s (1997) event-study logic, the analysis examines changes in comovement around an economically meaningful information event rather than immediate abnormal returns. The sample covers daily observations from 3 January 2022 to 6 April 2026. The baseline break is set at 30 May 2024, when Google announced its first Malaysian data centre and Google Cloud region (Google, 2024). This date is used because it made the AI theme more directly observable through
Malaysia’s domestic infrastructure setting. Alternative AI-related domestic events and wider eventwindow specifications are tested as robustness checks. Figure 1 links the conceptual framework to the empirical design by showing how external AI-sensitive market attention may become visible through Malaysian technology, utilities, and property/REIT channels. These channels correspond to the compute, power, and site-based mechanisms used to structure the proxy design in Table 1.
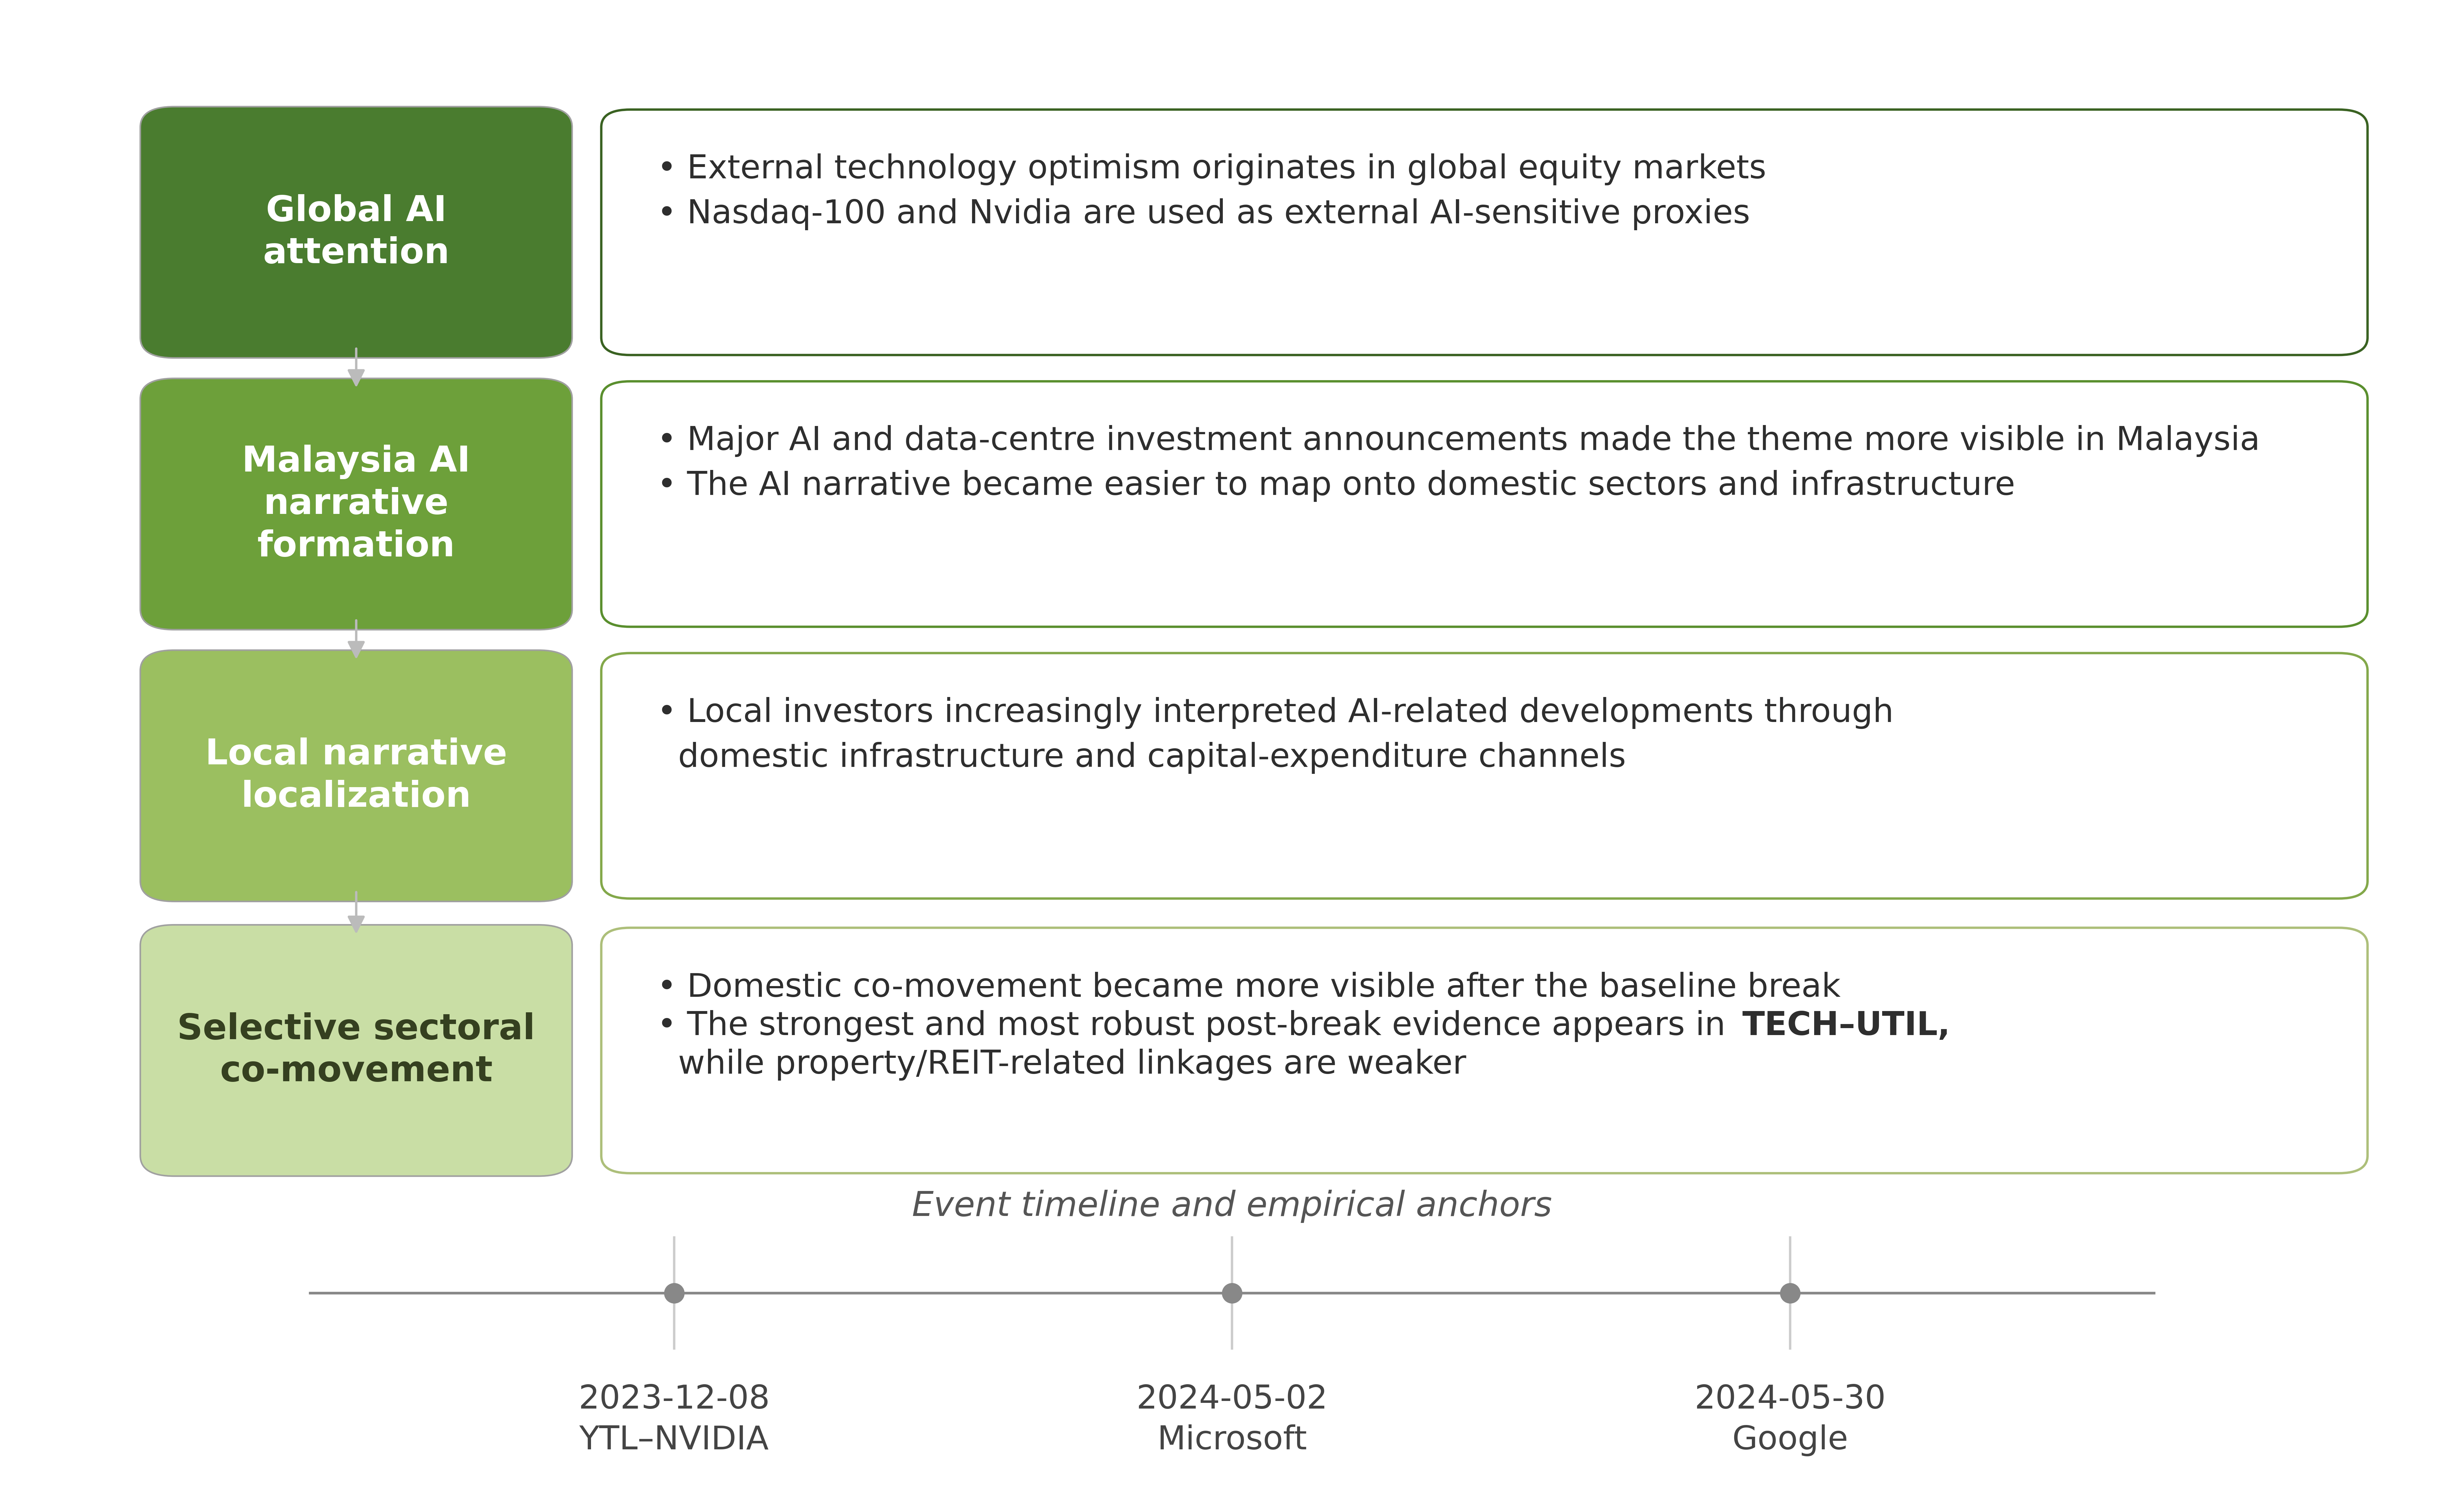
Note. The figure shows how global AI attention becomes locally visible through Malaysian implementation channels and sectoral co-movement; no causal claim is implied.
The dataset combines external AI-sensitive proxies, market controls, and Malaysian sector proxies. External technology-market conditions are represented by the Nasdaq-100 Index (NDX) and NVIDIA Corporation (NVDA). NDX includes 100 of the largest domestic and international non-financial companies listed on the Nasdaq Stock Market, while NVDA provides a concentrated global AI hardware and semiconductor reference point (Nasdaq, 2026). Global risk sentiment is controlled using the Cboe Volatility Index (VIX), which measures near-term volatility expectations conveyed by S&P 500 Index option prices (Cboe Global Markets, 2026). Broad domestic market movement is controlled using the FTSE Bursa Malaysia KLCI (KLCI), which comprises the largest 30 companies listed on Bursa Malaysia’s Main Market by full market capitalization, subject to index eligibility requirements (Bursa Malaysia, 2026).
| Variable | Full name | Construction / proxy | Role | Source |
|---|---|---|---|---|
| NDX | Nasdaq-100 Index | Daily log return of index level | External AI proxy | Yahoo Finance |
| NVDA | NVIDIA Corporation | Daily log return of closing price | Alternative external AI proxy | Yahoo Finance |
| VIX | Cboe Volatility Index | Daily log return of VIX level | Global risk control | Yahoo Finance |
| KLCI | FTSE Bursa Malaysia KLCI | Daily log return of index level | Domestic market control | Yahoo Finance |
| TECH | Malaysia technology proxy | Equal-weighted return of INARI Amertron (0166.KL) and Vitrox (0097.KL) | Domestic sector proxy | Yahoo Finance |
| UTIL | Malaysia utilities proxy | Equal-weighted return of YTL Power (6742.KL) and Tenaga Nasional (5347.KL) | Domestic sector proxy | Yahoo Finance |
| PROP_REIT | Malaysia property/real estate investment trust (REIT) proxy | Equal-weighted return of Sunway Bhd (5211.KL) and IGB REIT (5227.KL) | Domestic sector proxy | Yahoo Finance |
| CONS | Malaysia construction proxy | Daily log return of Gamuda Bhd (5398.KL) | Contextual sector proxy | Yahoo Finance |
| INDUS | Malaysia industrials proxy | Daily log return of Press Metal Aluminium (8869.KL) | Contextual sector proxy | Yahoo Finance |
| Post | Post-break indicator | 1 from 30 May 2024 onward; 0 otherwise | Break dummy | Author-defined |
NVDA
NVIDIA Corporation
Daily log return of closing price
Alternative external AI proxy
Yahoo Finance
VIX
Cboe Volatility Index
Daily log return of VIX level
Global risk control
Yahoo Finance
KLCI
FTSE Bursa Malaysia KLCI
Daily log return of index level
Domestic market control
Yahoo Finance
TECH
Malaysia technology proxy
Equal-weighted return of INARI Amertron (0166.KL) and Vitrox (0097.KL)
Domestic sector proxy
Yahoo Finance
UTIL
Malaysia utilities proxy
Equal-weighted return of YTL Power (6742.KL) and Tenaga Nasional (5347.KL)
Domestic sector proxy
Yahoo Finance
PROP_REIT
Malaysia property/real estate investment trust (REIT) proxy
Equal-weighted return of Sunway Bhd (5211.KL) and IGB REIT (5227.KL)
Domestic sector proxy
Yahoo Finance
CONS
Malaysia construction proxy
Daily log return of Gamuda Bhd (5398.KL)
Contextual sector proxy
Yahoo Finance
INDUS
Malaysia industrials proxy
Daily log return of Press Metal Aluminium (8869.KL)
Contextual sector proxy
Yahoo Finance
Post
Post-break indicator
1 from 30 May 2024 onward; 0 otherwise
Break dummy
Authordefined
Note. Sample period: 3 January 2022–6 April 2026. All market variables are daily log returns in percentage terms. Sector proxies are winsorised at the constituent level before proxy construction.
The Malaysian sector proxies are TECH, UTIL, and PROP_REIT, representing technology, utilities, and property/REIT exposure. CONS (construction proxy) and INDUS (industrials proxy) are included as contextual comparators for the correlation-structure figure rather than as focal hypothesis variables. Table 1 reports the variable definitions, proxy construction, empirical role, and data sources used in the analysis. The firm-based proxies are narrower than broad sector indices, but they keep the empirical design close to the compute, power, and site-based channels developed in the conceptual framework. This construction is consistent with prior evidence on data centres as technology-oriented property assets and on the electricity implications of AI and data-centre expansion (International Energy Agency, 2025; Marzuki & Newell, 2019; Takci et al., 2025; Wang, 2025). All price series are obtained from Yahoo Finance daily historical records (Yahoo Finance, 2026). The series were accessed from Yahoo Finance in April 2026, and the final sample ends on 6 April 2026. Adjusted closing prices are used where available, with closing prices used only when adjusted prices are unavailable. To align Malaysian and US trading calendars, the series are merged by calendar date and forward filled with a maximum window of two days. Daily continuously compounded returns are calculated as: ri,t = 100 × ln (
Pi,t ), Pi,t−1 where Pi,t is the adjusted closing price of asset i on trading day t. Returns are reported in percentage terms. Individual ticker-level returns are winsorised at the 1st and 99th percentiles before sector proxies are formed. For each sector proxy s, the equal-weighted return is calculated as: R s,t =
∑ ri,t , Ns i∈Ss where Ss is the set of constituent firms in sector proxy 𝑠, and Ns is the number of firms in that proxy. This construction is used for TECH, UTIL, and PROP_REIT. Leave-one-out tests are later used to assess whether the results depend on any single constituent firm. Baseline Break and Correlation Testing The analysis first examines whether domestic co-movement changes across the pre-break and postbreak sub-samples. For a given asset pair xt and yt , the change in Pearson correlation is defined as: post pre
Δρxy = ρxy − ρxy , pre post where ρxy and ρxy denote the pre-break and post-break correlations. Correlation-based comovement measures are widely used to study market interdependence, but changes in correlation should not be treated as direct evidence of causal transmission (Forbes & Rigobon, 2002). In this study, the correlation comparison is therefore used as an initial test of changed co-movement. This interpretation is also consistent with investor co-attention research, which shows that shared investor attention can increase return co-movement across related assets (Su & Wang, 2021). Since a simple pre/post comparison remains descriptive, Fisher’s r-to-z transformation is used to test whether the observed correlation changes are statistically significant (Fisher, 1921):
tanh−1(ρpost ) − tanh−1 (ρpre )
, √1/(npost − 3) + 1/(npre − 3)
where npre and npost are the non-overlapping sample sizes before and after the break. This test evaluates whether the observed correlation shifts are statistically distinguishable rather than only visually descriptive. Rolling-Correlation Regression To examine time-varying linkage dynamics, the analysis constructs 60-day rolling Pearson correlations: ρ60 xy,t = Corr(xt−59:t , yt−59:t ), where ρ60 xy,t is the rolling correlation between xt and yt ending on day t. The rolling-correlation analysis covers two relationships: external synchronization between global AI-sensitive proxies and Malaysian technology, and domestic inter-sectoral co-movement among TECH, UTIL, and PROP_REIT. This design follows the paper’s narrative-localization argument: global narratives become more relevant to local markets when investors can attach them to domestic sectors and constraints (Andrei et al., 2023; Merton, 1987; Shiller, 2017). The rolling-correlation series are modelled using the following interaction specification: ρ60 j,t = α + β1 AIt + β2 Post t + β3 (AIt × Post t ) + γ1 VIX t + γ2 KLCIt + εt , where ρ60 j,t represents the 60-day rolling correlation for domestic linkage j , with j ∈ TECH-UTIL,TECH-PROP_REIT,UTIL-PROP_REIT . AIt denotes the external AI-sensitive proxy, measured by NDX in the baseline model and NVDA in the robustness checks. Post t equals one from 30 May 2024 onward and zero otherwise. VIXt and KLCIt control for global risk sentiment and broad Malaysian market movement. Adjacent 60-day rolling correlations share most of their underlying daily returns, which can generate serial dependence in the regression errors. All rolling-correlation regressions therefore report Newey– West heteroskedasticity- and autocorrelation-consistent (HAC) standard errors, with the lag length set to 59 to match the maximum overlap implied by a 60-day window (Newey & West, 1987). This provides more conservative inference than ordinary heteroskedasticity-robust standard errors (White, 1980). Robustness Design The robustness design addresses two concerns. The first is event timing. Although 30 May 2024 is used as the baseline break, the analysis also tests two earlier AI-related domestic events: the YTL Power International–NVIDIA collaboration announcement on 8 December 2023 and the Microsoft Malaysia announcement on 2 May 2024 (Microsoft, 2024; YTL Power International, 2023). In addition, ±15 and ±30 trading-day exclusion windows are applied around the baseline break to reduce the possibility that the findings are driven by short-lived announcement-window trading behaviour. The second concern is proxy construction. Since TECH, UTIL, and PROP_REIT are constructed from selected listed firms rather than broad sector indices, the revised analysis applies a leave-one-out robustness design. Each constituent firm is excluded in turn, and the relevant sector proxy is reconstructed using the remaining constituent. Formally, for a sector proxy s, the leave-one-out return excluding firm k is: (−k)
∑ ri,t , Ns − 1 i∈Ss ,i≠k where R s,t is the alternative sector-proxy return after excluding firm k. With two-constituent proxies, this procedure also tests whether the result survives when a sector proxy is represented by the remaining single constituent. These checks assess whether the main co-movement pattern depends on one break date, one short announcement window, or one firm in the proxy construction. Link to the Hypotheses The empirical framework maps directly onto the three hypotheses. H1 is examined through rolling synchronization between global AI-sensitive proxies and Malaysian technology. H2 is tested through the Fisher r-to-z comparison of pre-break and post-break domestic correlations. H3 is evaluated through the HAC-adjusted rolling-correlation regressions and robustness checks. This design distinguishes whether post-break co-movement is concentrated in the technology–utilities linkage or extends more broadly to property/REIT-related channels.
RESULTS AND DISCUSSION Empirical Context and Descriptive Baseline The empirical results are interpreted within Malaysia’s expanding AI, cloud-infrastructure, and industrial-policy setting. The Google announcement on 30 May 2024 serves as the main empirical anchor because it translated the global AI narrative into visible domestic commitments, including Malaysia’s first Google data centre and Google Cloud region (Google, 2024). This event followed other AI-related domestic developments, including Microsoft’s Malaysia cloud and AI investment announcement and the YTL–NVIDIA collaboration (Microsoft, 2024; YTL Power International, 2023). This setting matters because financial narratives become market-relevant only when investors can connect broad themes to identifiable firms, sectors, or constraints. Narrative economics and investorattention research show that market responses depend not only on information arrival, but also on how investors interpret and attach that information to investable assets (Andrei et al., 2023; Merton, 1987; Shiller, 2017). In Malaysia, the relevant channel is not AI as a global abstraction, but AI as a domestic implementation story involving data centres, cloud deployment, semiconductor exposure, electricity demand, and site-based infrastructure. Malaysia’s AI governance agenda and semiconductor position provide the institutional and industrial background for this interpretation (Bank Negara Malaysia, 2024; Ministry of Science, Technology and Innovation, 2024).
| Med | |||||
|---|---|---|---|---|---|
| Variable | Obs. | Mean | SD | Min | Max |
| ian | |||||
| - | 0.07 | ||||
| NDX | 1,101 | 0.030 | 1.370 4.070 - | 3.410 0 0.16 | |
| NVDA | 1,101 | 0.140 | 3.020 7.970 - | 8.130 0 - 20.49 | |
| VIX | 1,101 | -0.010 | 6.590 15.99 0 - | 0.46 0 0.00 | |
| KLCI | 1,099 | 0.010 | 0.580 1.510 - | 1.550 0 0.00 | |
| TECH | 1,099 | -0.050 | 1.810 6.510 - | 6.580 0 0.00 | |
| UTIL | 1,099 | 0.120 | 1.330 4.450 | 5.210 0 | |
| PROP_ | 1,099 | 0.090 | - 0.970 | 0.00 4.400 | |
| REIT | 3.660 | 0 | |||
NVDA
VIX
KLCI
TECH
UTIL
PROP_ REIT
Note. Values are daily log returns in percentage terms. Returns are winsorised at the 1st and 99th percentiles. Obs. = nonmissing observations.
Table 2 provides the descriptive baseline for the return series used in the empirical analysis. Its purpose is not to rank average asset performance, but to show the distributional setting in which the comovement tests are conducted. Since the paper focuses on sectoral linkage rather than mean-return prediction, the central question is whether Malaysian sector relationships changed after the AI narrative acquired a clearer domestic infrastructure meaning.
Correlation-Shift Evidence
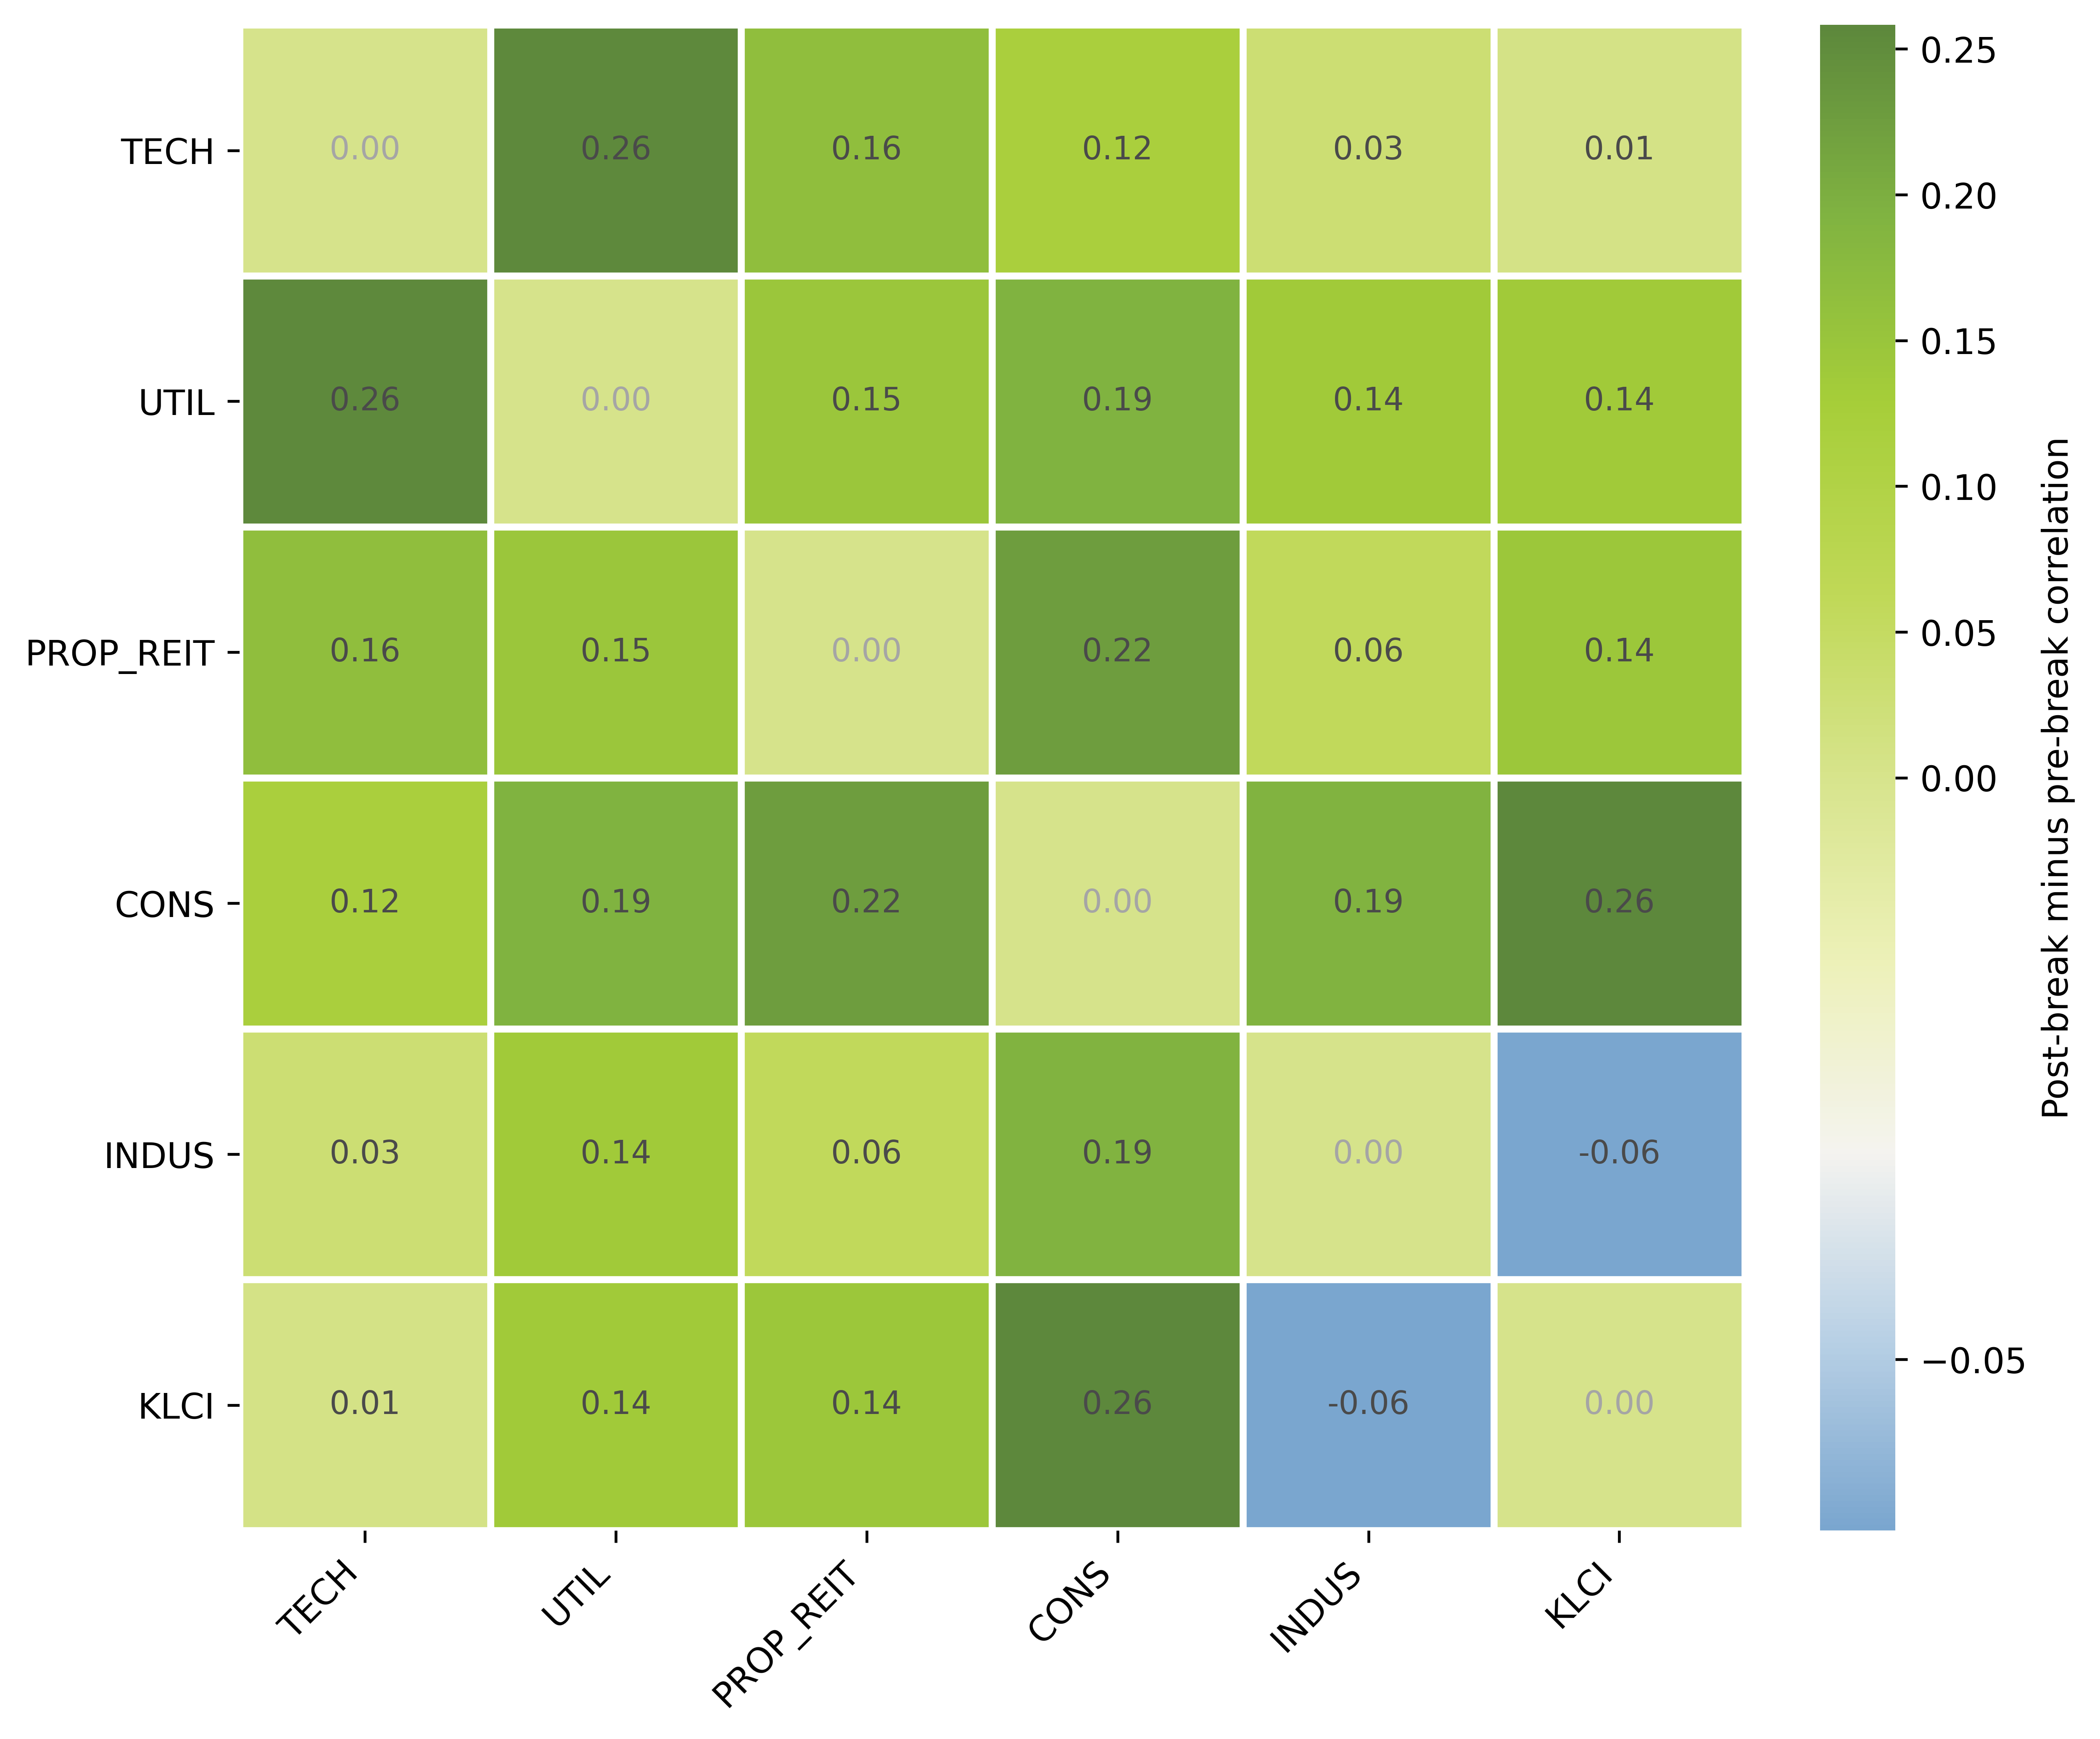
Note. Values show post-break minus pre-break Pearson correlations. Break date: 30 May 2024. CONS = construction proxy; INDUS = industrials proxy.
The correlation evidence begins with a broad view of domestic co-movement changes. Figure 2 maps post-break minus pre-break correlations across the Malaysian sector and market-control variables. The figure is used as a contextual overview rather than as the main hypothesis test. It shows that the postbreak period was associated with wider changes in domestic co-movement, but that these changes were not evenly distributed across all linkages. Construction and industrial proxies are included as contextual comparators, while the focal interpretation remains centred on the technology, utilities, and property/REIT channels. Figure 3 then narrows the analysis to the key linkages used in the formal tests. The slopechart makes the pre-break to post-break movement easier to compare across the selected domestic relationships. It shows that the focal linkages moved upward after the break, with the technology–utilities relationship displaying the largest increase among the main tested sector pairs. This visual pattern supports the view that the localized AI narrative became most visible where technology exposure met electricity and utility capacity.
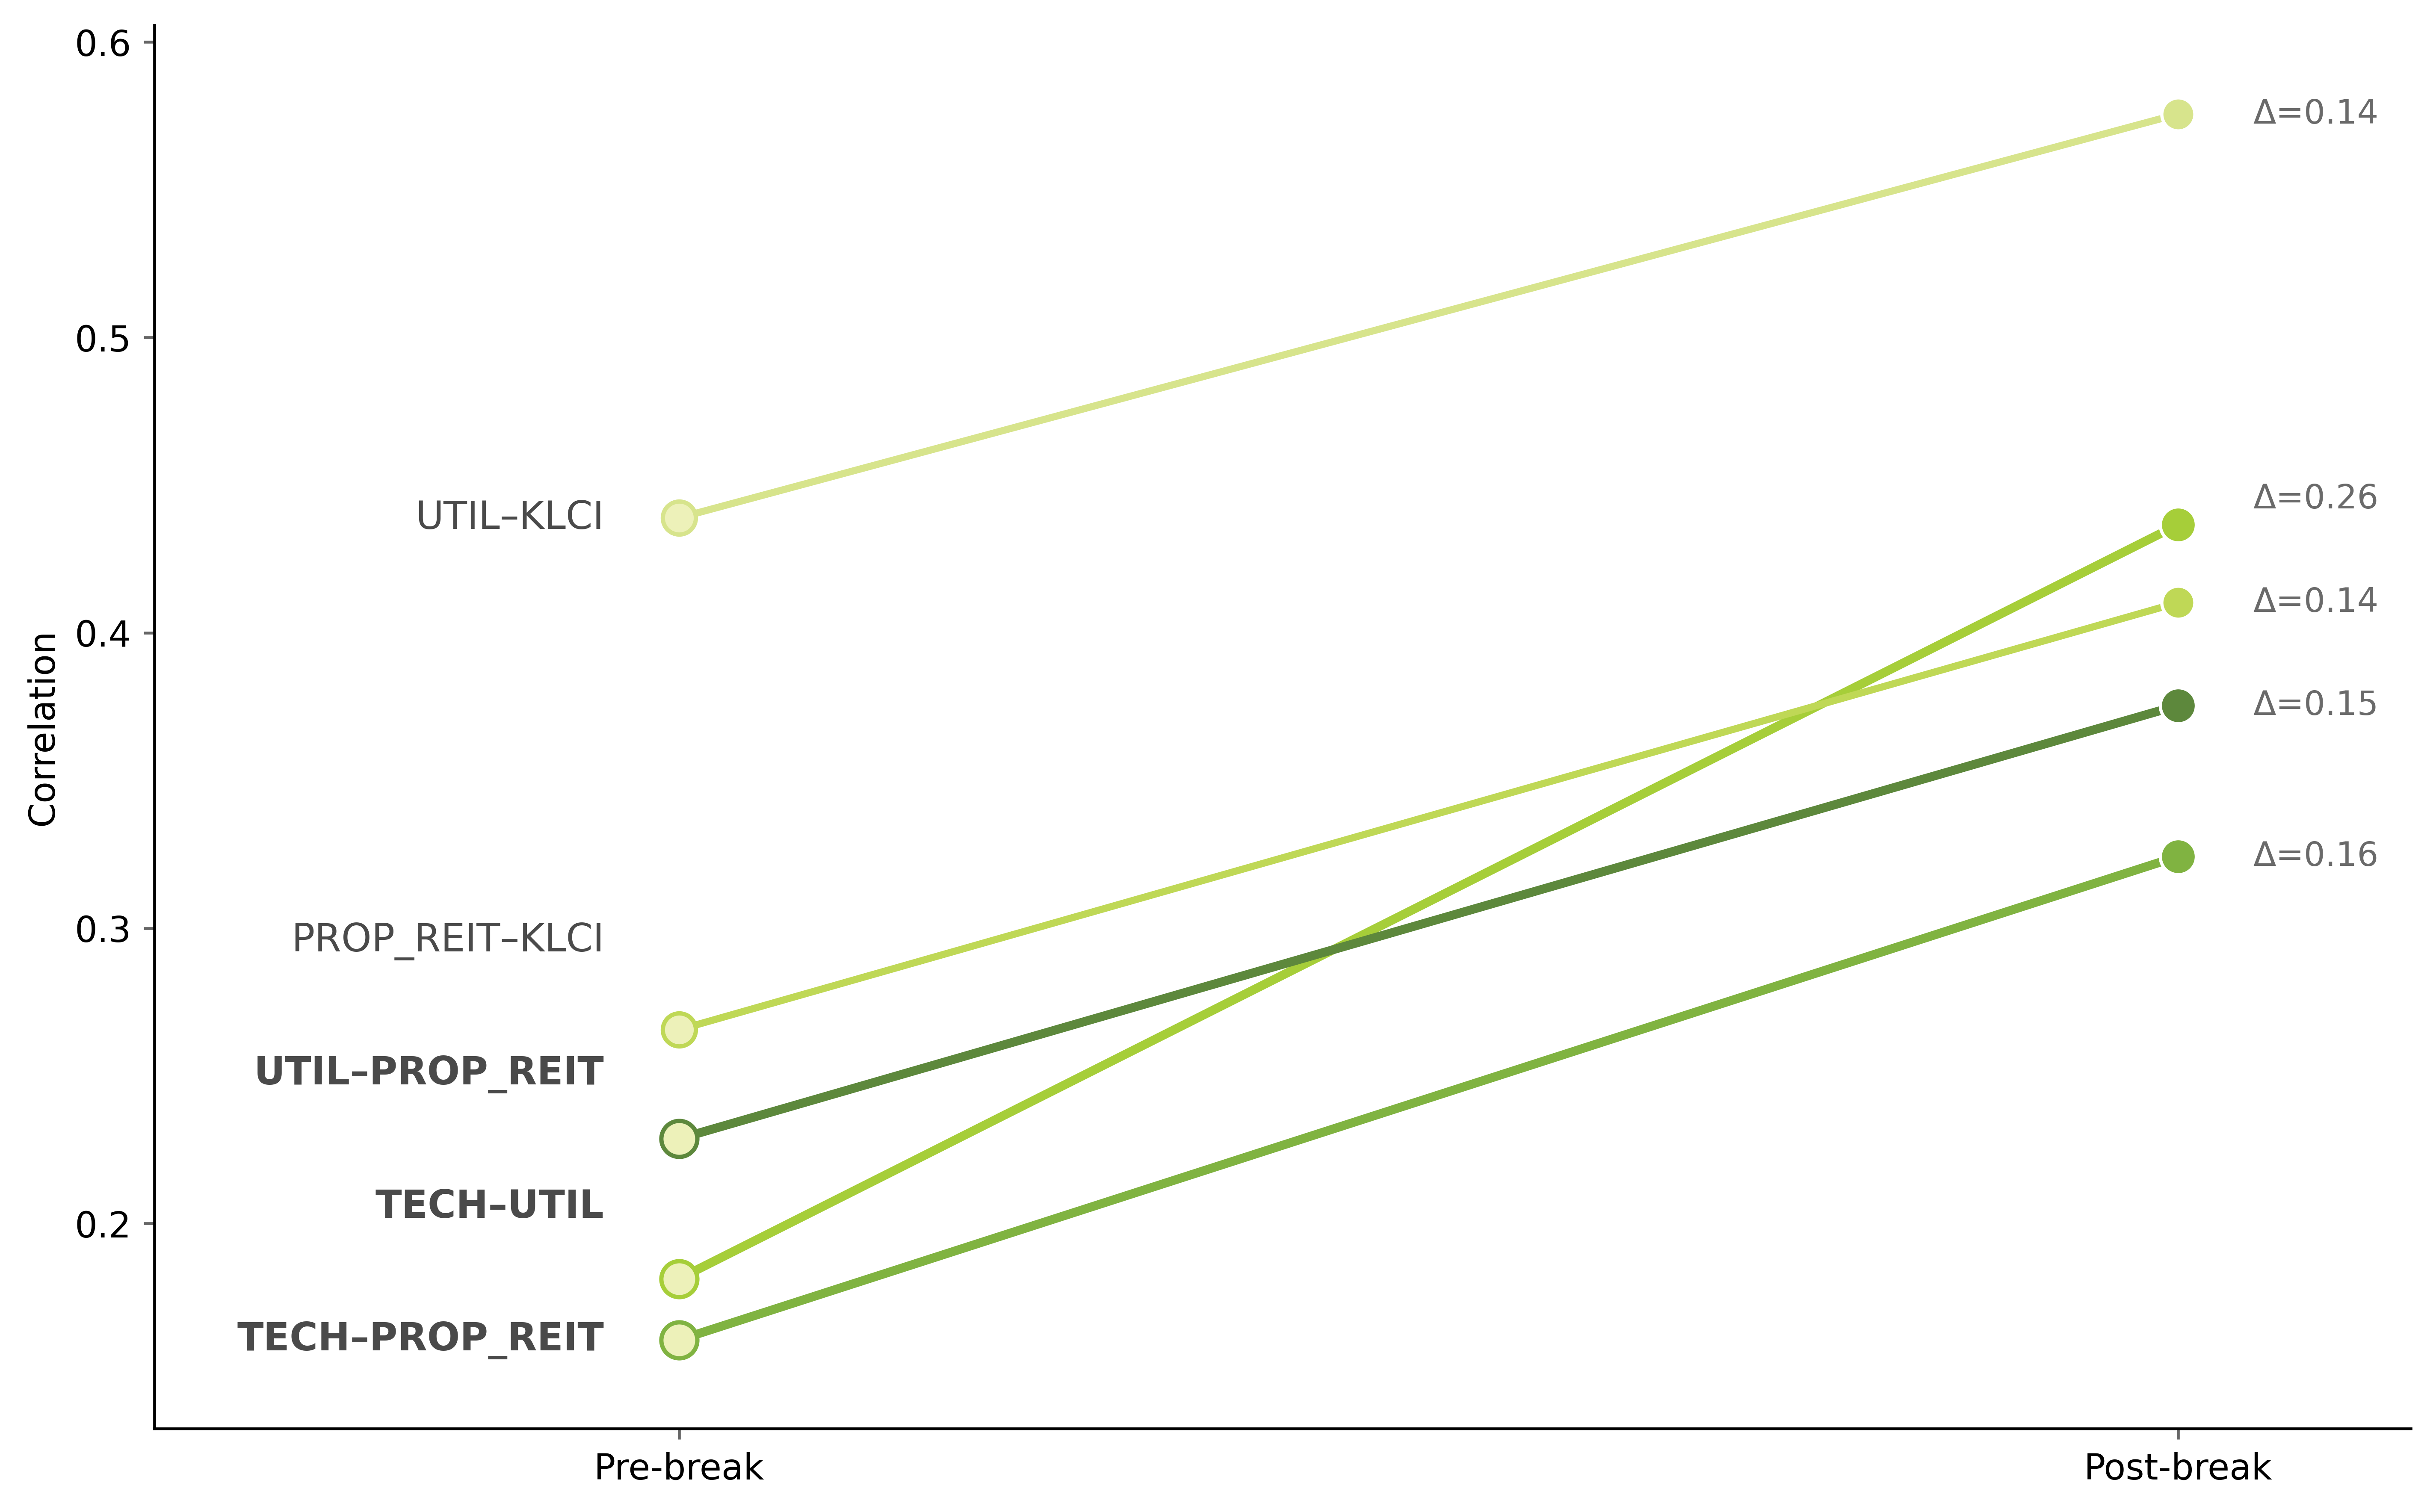
Note. The figure compares pre-break and post-break Pearson correlations for selected domestic linkages. Values on the right indicate correlation changes.
Table 3 provides the statistical test behind these visual patterns. The Fisher r-to-z results confirm that the observed correlation increases are statistically meaningful rather than only visually apparent. This gives initial support to the compute–power interpretation: once AI became linked to domestic infrastructure deployment, the market relationship between technology exposure and utilities became more visible. The property/REIT-related linkages also move in the expected direction, which is consistent with the view that data centres can form part of a technology-oriented property segment (Marzuki & Newell, 2019). However, correlation evidence remains an initial layer of evidence. Correlation shifts can reflect changing interdependence among sectors, broader market conditions, or thematic investor attention, not only direct transmission from one sector to another (Forbes & Rigobon, 2002; Su & Wang, 2021). The next step is therefore to examine whether the pattern persists dynamically and survives more conservative regression inference.
| Linkage | Pre-break r | Post-break r | Change | Fisher z | p-value |
|---|---|---|---|---|---|
| TECH–UTIL | 0.181 | 0.437 | 0.255 | 4.665 | <0.001 |
| TECH–PROP_REIT | 0.161 | 0.324 | 0.164 | 2.858 | 0.004 |
| UTIL–PROP_REIT | 0.229 | 0.375 | 0.147 | 2.652 | 0.008 |
| PROP_REIT–KLCI | 0.266 | 0.410 | 0.145 | 2.682 | 0.007 |
| UTIL–KLCI | 0.439 | 0.576 | 0.137 | 3.032 | 0.002 |
Note. Fisher r-to-z tests compare pre-break and post-break Pearson correlations. Break date: 30 May 2024.
Rolling-Correlation Evidence
Figure 4 extends the analysis by showing how the relevant linkages evolved over time. The external synchronization panel shows that the links between global AI-sensitive proxies and Malaysian technology were uneven rather than mechanically continuous. This is consistent with recent AI-finance research showing that AI-related attention can affect trading behaviour, liquidity, volatility, crash risk, and market efficiency, but that these effects depend on market context and information channels (Bai et al., 2025; Cheng et al., 2025; Li et al., 2025; Saif-Alyousfi, 2025). The domestic panel in Figure 4 is more central to the paper’s main argument. The technology–utilities relationship shows the clearest and most persistent post-break elevation. This is economically plausible because AI infrastructure is closely tied to electricity demand, grid readiness, and data-centre operation. Recent energy research similarly links data centres to power-system flexibility, electricity demand, and the measurement of data-centre energy use (International Energy Agency, 2025; Takci et al., 2025; Wang, 2025). The rolling evidence therefore suggests that the AI narrative became most visible where global technology attention met a binding domestic implementation requirement: compute capacity and power capacity.
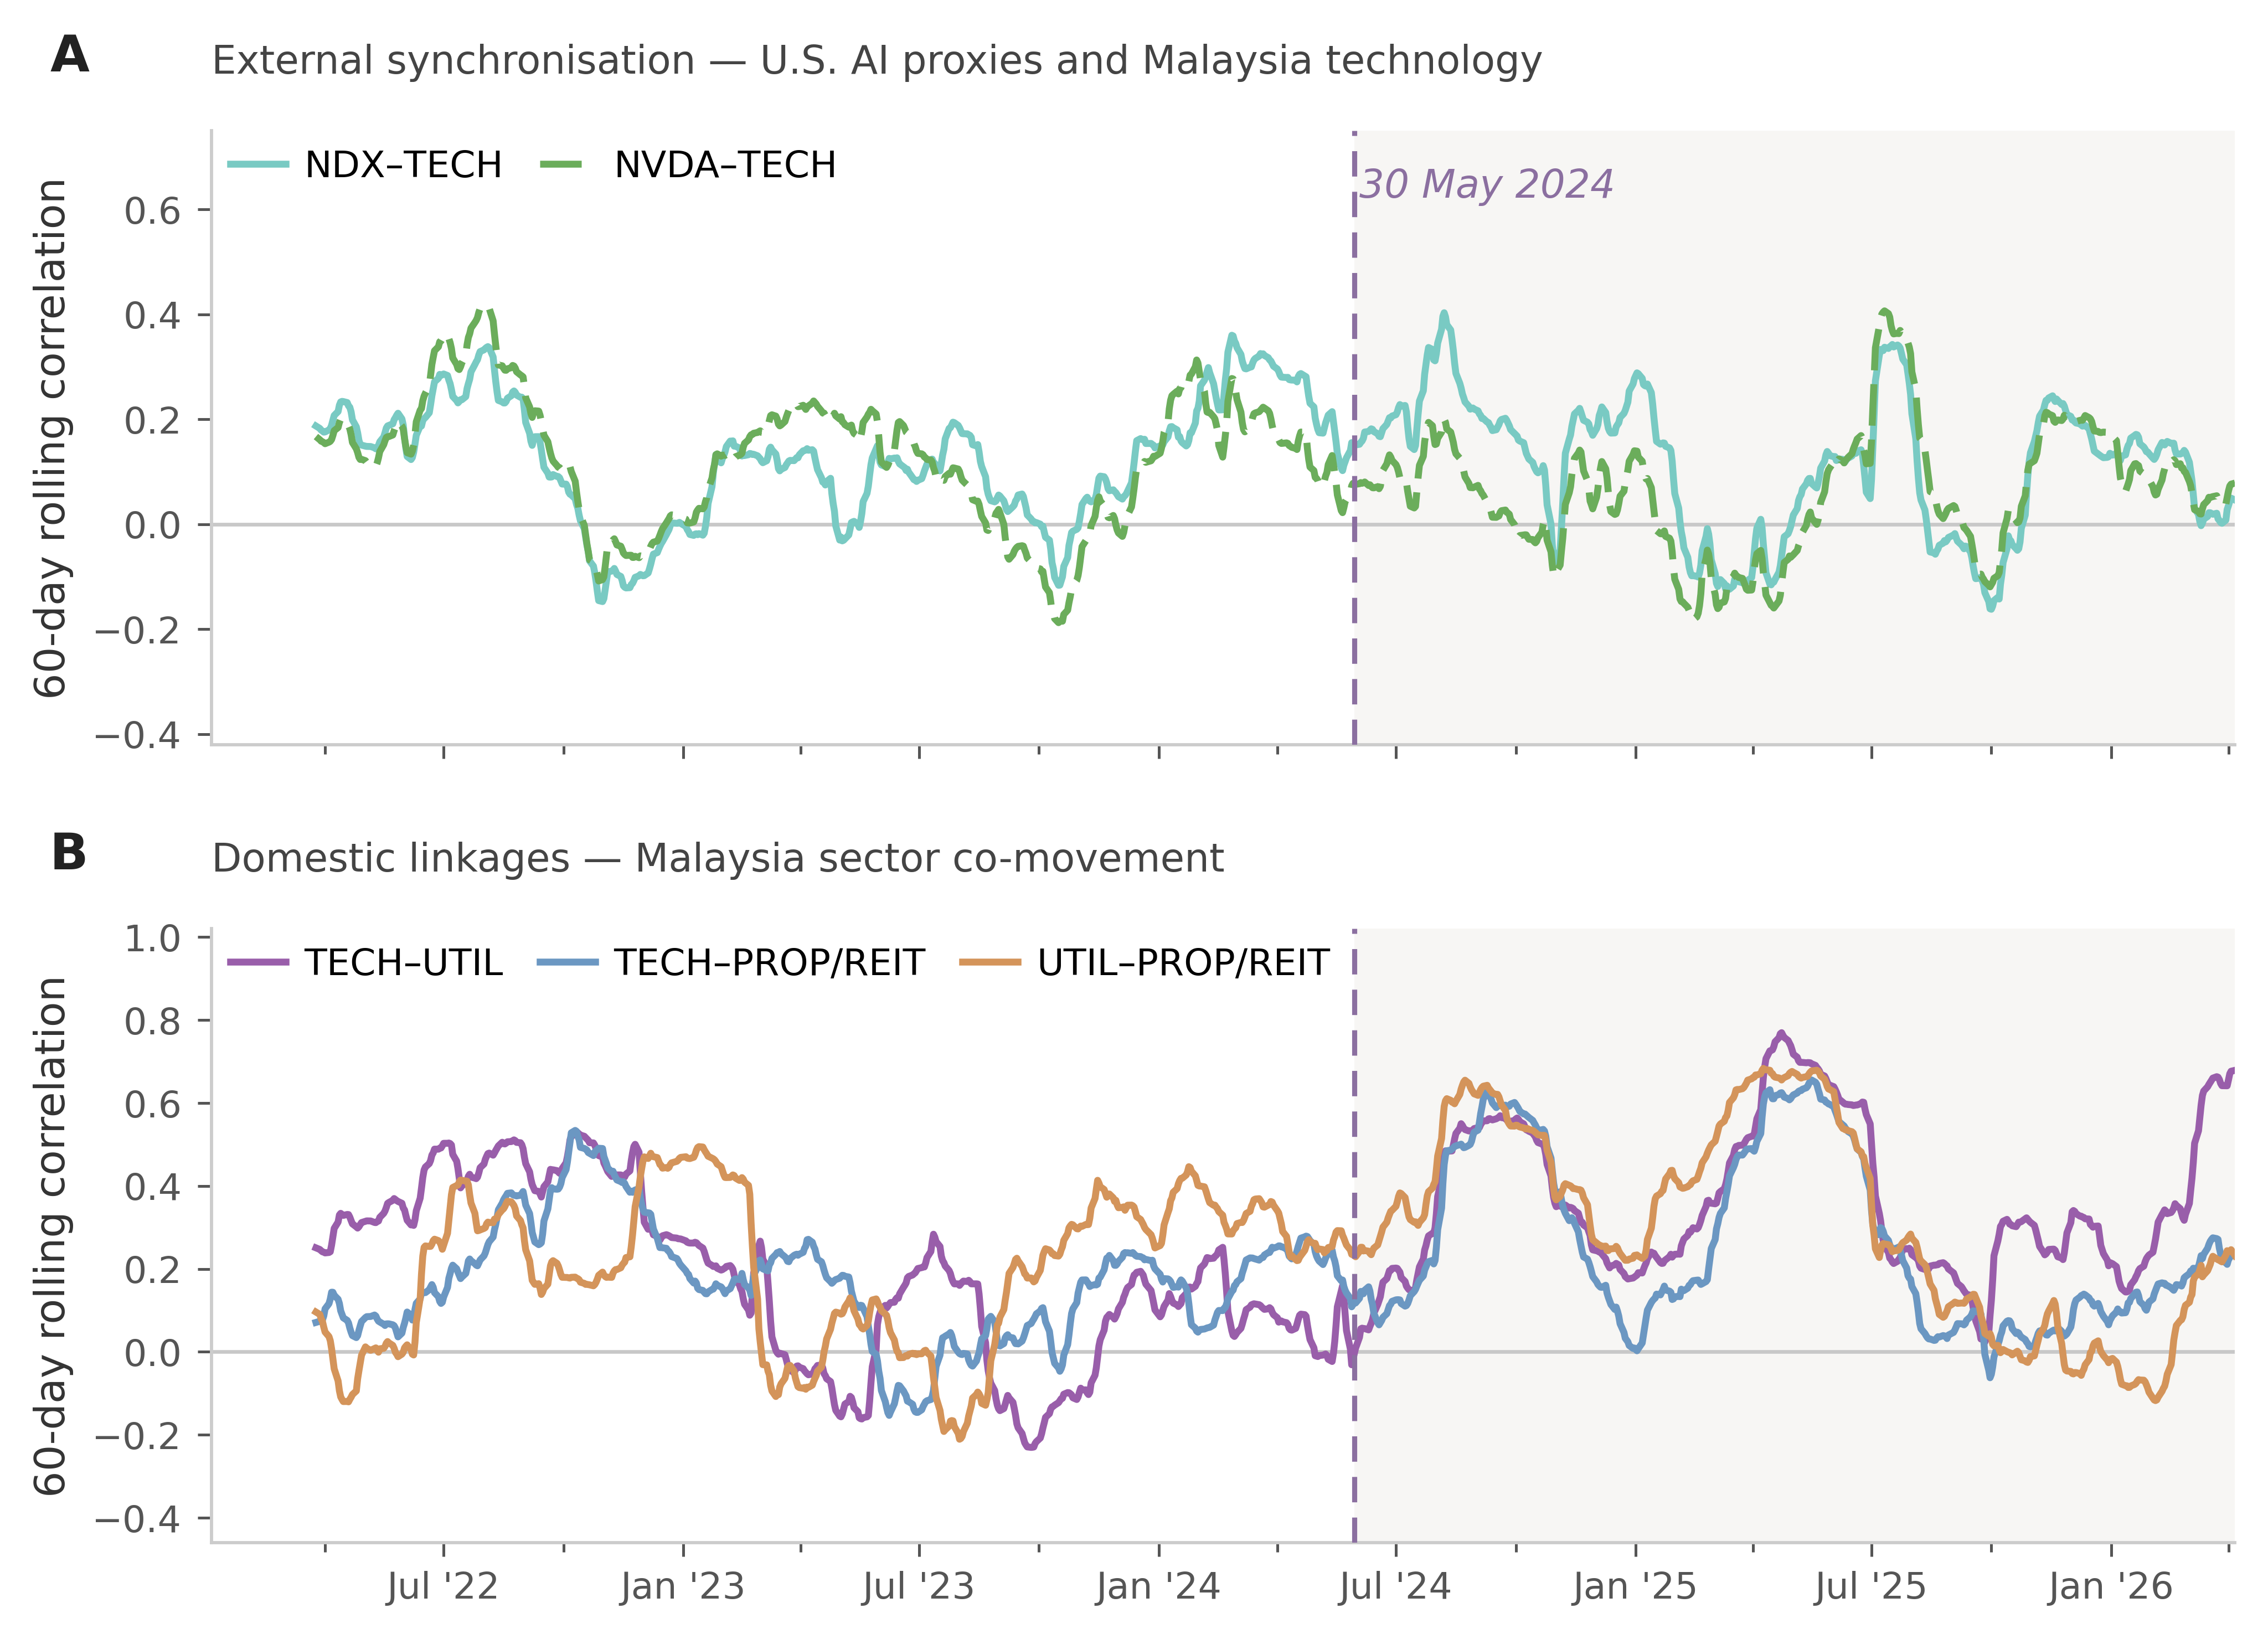
Note. The figure shows 60-day rolling Pearson correlations for external and domestic linkages. The dashed line marks the 30 May 2024 Google announcement.
HAC-Adjusted Regression Evidence
Table 4 provides the main regression test of the rolling-correlation evidence. Because the dependent variables are 60-day rolling correlations, adjacent observations share most of their underlying daily returns. The revised specification therefore uses Newey–West HAC standard errors with maxlags = 59 to account for overlapping-window serial dependence (Newey & West, 1987). This provides a stricter inference framework than ordinary heteroskedasticity-robust errors (White, 1980). After conditioning on global risk sentiment through VIX and broad domestic market movement through KLCI, the Post coefficient remains statistically significant only for the technology–utilities linkage (β = 0.180, p = 0.016). The corresponding coefficients for TECH–PROP_REIT (β = 0.095, p = 0.186) and UTIL–PROP_REIT (β = 0.114, p = 0.206) are positive but do not survive HAC(59) adjustment. The TECH–UTIL equation also returns a higher R² (0.178) than the other two equations (0.072 and 0.069), indicating that the specification captures more of the variation in this linkage than in the property/REITrelated linkages. This result forms the empirical core of the study. The evidence does not indicate a uniform strengthening of all AI-adjacent Malaysian sector pairs. It shows a concentrated post-break increase in the compute–power channel. Although the theoretical narrative links compute, power, and land, the regression evidence shows that the market signal is strongest where AI implementation meets an immediate operational constraint: electricity and power capacity. The property/REIT channel remains economically relevant, especially given the role of data centres as technology-oriented property assets, but it appears more contingent on asset-level exposure and firm-specific characteristics (Marzuki & Newell, 2019; Sulaiman et al., 2023).
| (1) TECH–UTIL | (2) TECH–PROP_REIT | (3) UTIL–PROP_REIT | |
|---|---|---|---|
| NDX | -1.429** (0.500) | -0.678 (0.544) | 0.402 (0.575) |
| Post | 0.180* (0.075) | 0.095 (0.072) | 0.114 (0.090) |
| NDX × Post | 0.494 (0.854) | 0.774 (0.852) | -0.329 (1.071) |
| VIX | -0.246** (0.093) | -0.126 (0.108) | -0.041 (0.111) |
| KLCI | 0.034 (0.730) | -0.676 (0.754) | -0.526 (0.983) |
| R² | 0.178 | 0.072 | 0.069 |
KLCI
Note. Dependent variable: 60-day rolling Pearson correlation. Newey–West HAC standard errors with maxlags = 59 are in parentheses. N = 1,052. * p < 0.05; ** p < 0.01.
The NDX × Post interaction terms are not statistically significant. The post-break adjustment is therefore better interpreted as a domestic co-movement shift than as an amplified U.S.-to-Malaysia AI transmission effect. This distinction is consistent with investor-attention research, where thematic attention can reorganize perceived linkages among assets without implying direct one-to-one spillover (Andrei et al., 2023; Gao & Tian, 2025; Nyman et al., 2021). Robustness and Alternative Explanations Table 5 evaluates whether the central result depends on the selected break date or on the construction of firm-based sector proxies. The break-date and event-window checks show that the technology– utilities correlation shift remains stable when the break date is moved to the YTL–NVIDIA and Microsoft events and when ±15 and ±30 trading-day exclusion windows are applied around the Google baseline. This reduces the concern that the result is a single-date announcement anomaly.
| Panel A. Break-date and event-window robustness for TECH–UTIL | |||||
|---|---|---|---|---|---|
| Specification | Pre-break r | Post-break r | Change | Fisher z | p-value |
| 8 Dec 2023 (YTL–NVIDIA) | 0.220 | 0.375 | 0.155 | 2.807 | 0.005 |
| 2 May 2024 (Microsoft) | 0.192 | 0.422 | 0.230 | 4.211 | <0.001 |
| 30 May 2024 (Google, main) | 0.181 | 0.437 | 0.255 | 4.665 | <0.001 |
| ±15 trading-day window | 0.192 | 0.434 | 0.242 | 4.367 | <0.001 |
| ±30 trading-day window | 0.196 | 0.438 | 0.242 | 4.310 | <0.001 |
Panel A. Break-date and event-window robustness for TECH–UTIL Specification
Pre-break r
Post-break r
Change
Fisher z p-value
8 Dec 2023 (YTL–NVIDIA)
2 May 2024 (Microsoft)
30 May 2024 (Google, main)
±15 trading-day window
±30 trading-day window
Panel B. Leave-one-out proxy robustness Linkage
Specs tested
Positive changes
Sig. positive
Change range
TECH–UTIL
0.126 to 0.262
TECH–PROP_REIT
-0.035 to 0.229
UTIL–PROP_REIT
0.023 to 0.168
Note. Panel A reports Fisher tests for alternative break dates and exclusion windows. Panel B reports leave-one-out sectorproxy checks. Sig. positive = positive change with p < 0.05.
The leave-one-out proxy checks address the firm-selection concern. The technology–utilities result remains stable across firm-exclusion variants, indicating that the core co-movement pattern is not driven by one constituent firm. The property/REIT-related results are more sensitive to proxy construction, especially when the property/REIT proxy is reduced to the pure REIT constituent. This pattern supports a selective interpretation: the localized AI narrative is most consistently visible in market linkages where it intersects with immediate physical constraints, particularly power supply and electricity capacity. The post-break window coincided with broader Malaysian market movement, energy-sector attention, semiconductor-cycle developments, property-sector variation, and changing global risk sentiment. The VIX and KLCI controls reduce part of this concern, while the break-date and proxy checks reduce sensitivity to timing and firm selection. The findings are therefore best read as association-based asset-pricing evidence: they identify where the localized AI narrative became most visible in market linkages, rather than claiming that AI localization alone caused the full adjustment. This interpretive boundary is consistent with recent AI-governance and AI-adoption research. Malaysia’s AI policy environment and firm-level adoption interest have developed quickly, but governance frameworks, operational adoption, and capital-market pricing do not necessarily move at the same speed (Enshassi et al., 2025; Keith, 2024; Lada et al., 2023; Leong & Freeman, 2024; Xu et al., 2024).
Hypotheses and Contribution
The evidence gives a differentiated verdict on the hypotheses. H1 receives limited support because global AI-sensitive proxies are relevant to Malaysian technology, but the relationship is episodic rather than mechanically continuous. H2 receives stronger support because the formal correlation tests show statistically meaningful post-break increases in domestic co-movement. H3 receives selective support: the localized AI narrative is most clearly reflected in the technology–utilities linkage, while the wider property/REIT channel is directionally consistent but less robust after HAC adjustment and proxysensitivity checks. This pattern sharpens the paper’s contribution to narrative economics and investor-attention research. Existing studies show that narratives, attention, and information environments can affect how investors process market signals and attach value to assets (Andrei et al., 2023; Merton, 1987; Shiller, 2017). The Malaysian evidence adds a more specific mechanism: a global technology narrative becomes locally price-relevant only when investors can map it onto concrete domestic implementation constraints. In this case, the clearest constraint is the compute–power relationship linking technology exposure to utilities and electricity capacity. The paper also contributes to the growing AI-finance literature by showing that AI-related attention is not only a firm-level or global-market phenomenon. It can also appear through changes in domestic sectoral co-movement when the narrative becomes connected to local implementation capacity (Cheng et al., 2025; Li et al., 2025; Saif-Alyousfi, 2025). The main finding is therefore not simply that AI mattered for Malaysian equities, but that its market relevance appeared selectively through the sectors most directly tied to implementation capacity.
CONCLUSION
Global AI narratives do not become equally price-relevant across all AI-adjacent sectors in a smaller emerging market. The Malaysian evidence points to a more selective process. Once the AI narrative became tied to visible domestic implementation channels, its strongest market signal appeared in the technology–utilities linkage. Property/REIT-related linkages moved in the expected direction, but they were weaker under conservative inference and more sensitive to proxy construction. The central conclusion is therefore not that AI localization broadly repriced the Malaysian equity market. It is that AI became most visible where global technology attention met a binding local implementation constraint: compute capacity and power capacity. This finding refines the paper’s contribution to narrative economics and investor-attention research. Existing work shows that narratives, attention, and information environments can shape asset pricing and market behaviour (Andrei et al., 2023; Merton, 1987; Shiller, 2017). The Malaysian case adds a more specific mechanism: a global technology narrative becomes locally price-relevant only when investors can map it onto concrete domestic channels. Generic thematic labels are not enough. The market signal becomes clearer when the narrative attaches to observable implementation requirements, including data centres, cloud deployment, semiconductor exposure, electricity demand, and site-based capacity.
The paper also contributes to recent AI-finance research by showing that AI-related attention is not only a firm-level or global-market phenomenon. It can also appear through changes in domestic sectoral comovement when the narrative becomes linked to local implementation capacity (Cheng et al., 2025; Li et al., 2025; Saif-Alyousfi, 2025). The most important result is therefore selective rather than broadbased: the compute–power channel provides the clearest empirical route through which the global AI story entered Malaysian market linkages. The Malaysian setting gives this finding a concrete institutional background. The National Energy Transition Roadmap places energy-system transformation, renewable capacity, and long-term grid readiness within Malaysia’s development agenda (Ministry of Economy, 2023), while the National Semiconductor Strategy issued by the Ministry of Investment, Trade and Industry (MITI, 2024) positions semiconductor upgrading as a central industrial priority. These policy frameworks do not explain the market results by themselves, but they clarify why AI infrastructure, electricity capacity, and semiconductor exposure form a plausible domestic channel through which global AI attention could become locally investable. The finding is also consistent with Malaysia’s AI governance agenda and its established position in the E&E and semiconductor value chain (Bank Negara Malaysia, 2024; Ministry of Science, Technology and Innovation, 2024). The study has several boundaries that open useful directions for future research. The use of firm-based sector proxies allows the analysis to focus on listed firms closely tied to the compute, power, and sitebased channels, but it cannot fully replace broader sector-level portfolios or more granular firm-level exposure measures. The empirical design captures co-movement and market association, not uncontaminated causal effects. The daily equity data also reflect listed-market responses rather than private investment flows, actual data-centre capacity, or electricity-load outcomes. Future work could combine market prices with firm disclosures, data-centre investment records, electricity-demand indicators, or intraday trading data to trace how AI narratives move from investor attention to valuation and then to real-sector adjustment. The Malaysian case shows that global AI narratives acquire market relevance only when they meet domestic implementation capacity. In this study, that point of contact is the compute–power relationship. This linkage is not merely a correlation between adjacent sectors; it is the market channel through which the global AI narrative becomes constrained, interpreted, and priced within the domestic equity setting.
ACKNOWLEDGEMENT This research was not funded by any grant.
AUTHOR DECLARATION ON THE USE OF GENERATIVE AI
Generative AI was used solely to assist with English language editing and stylistic refinement. No AI tool was used to produce the research question, methodology, analysis, results, or conclusions. The authors critically reviewed all outputs and accept full responsibility for the final submitted manuscript.
DATA AVAILABILITY STATEMENT
The data used in this study are publicly available from Yahoo Finance. The cleaned return series used for the analysis are available from the corresponding author upon reasonable request.
References
- Andrei, D., Friedman, H. L., & Ozel, N. B. (2023). Economic uncertainty and investor attention. Journal of Financial Economics, 149(2), 179–217. https://doi.org/10.1016/j.jfineco.2023.05.003
- Bai, X., Zhao, W., & Liu, M. (2025). Artificial intelligence and stock price crash risk: Evidence from China. Pacific-Basin Finance Journal, 96, 103039. https://doi.org/10.1016/ j.pacfin. 2025. 103039
- Bank Negara Malaysia. (2024). Malaysia’s position in the global E&E value chain and the semiconductor industry. In Economic and Monetary Review 2024 (Box 1). https://www. bnm. gov.my/publications/emr2024/box1
- Barberis, N., Shleifer, A., & Vishny, R. (1998). A model of investor sentiment. Journal of Financial Economics, 49(3), 307–343. https://doi.org/10.1016/S0304-405X(98)00027-0
- Bursa Malaysia. (2026). FTSE Bursa Malaysia KLCI. https://www. bursamalaysia. Com / trade/ our_ products_services/indices/ftse_bursa_malaysia_indices/ftse_bursa_malaysia_klci
- Cboe Global Markets. (2026). VIX volatility products. https://www.cboe.com/tradable-products/vix/
- Cheng, Q., Lin, S., & Zhao, Y. (2025). Does generative AI facilitate investor trading? Early evidence from ChatGPT outages. Journal of Accounting and Economics, 80(2), 101775. https://doi.org/10.1016/j.jacceco.2025.101775
- Enshassi, M., Al-Maroof, R. S., Al-Maroof, A., Al-Hadhrami, T., AlQudah, A. A., Jarrah, M., & Alomari, K. M. (2025). Unveiling barriers and drivers of AI adoption for digital marketing in Malaysian SMEs. Journal of Open Innovation: Technology, Market, and Complexity, 11, 100519. https://doi.org/10.1016/j.joitmc.2025.100519
- Fisher, R. A. (1921). On the probable error of a coefficient of correlation deduced from a small sample. Metron, 1, 3–32.
- Forbes, K. J., & Rigobon, R. (2002). No contagion, only interdependence: Measuring stock market co-movements. The Journal of Finance, 57(5), 2223–2261. https://doi.org/10.1111/0022-1082.00494
- Gao, Y., & Tian, L. (2025). Media sentiment, investor attention, and market volatility. Finance Research Letters, 86, 108987. https://doi.org/10.1016/j.frl.2025.108987
- Google. (2024, May 30). Advancing Malaysia together: Google announces US$2 billion investment in Malaysia, including first Google data center and Google Cloud region. Google Cloud Press Corner. https://www.googlecloudpresscorner. com/ 2024-05-30-Advancing-Malaysia-Together-Google-Announces-US-2-Billion-Investment-in-Malaysia%2C -Including -First-Google-Data-Center-and-Google-Cloud-Region
- Hong, H., & Stein, J. C. (1999). A unified theory of underreaction, momentum trading, and overreaction in asset markets. The Journal of Finance, 54(6), 2143–2184. https://doi.org/10.1111/0022-1082.00184
- International Energy Agency. (2025). Energy and AI. https://www.iea.org/reports/energy-and-ai
- Keith, A. J. (2024). Governance of artificial intelligence in Southeast Asia. Global Policy, 15(5), 937–954. https://doi.org/10.1111/1758-5899.13458
- Lada, S., Chekima, B., Abdul Karim, M. R., Fabeil, N. F., Ayub, M. S., Amirul, S. M., Ansar, R., Bouteraa, M., Fook, L. M., & Zaki, H. O. (2023). Determining factors related to artificial intelligence (AI) adoption among Malaysia’s small and medium-sized businesses. Journal of Open Innovation: Technology, Market, and Complexity, 9(4), 100144. https://doi.org/10.1016/j.joitmc.2023.100144
- Leong, P. P. Y., & Freeman, B. (2024). Riding the waves over generative AI in Malaysia: Policies and responses. Communication Research and Practice, 10(3), 362–374. https://doi.org/10.1080/ 22041451.2024.2346421
- Li, X., Jia, S., & Xue, F. (2025). How investors’ ChatGPT attention influence stock market? A liquidity perspective. Research in International Business and Finance, 77, 102939. https://doi.org/10.1016/j.ribaf.2025.102939
- MacKinlay, A. C. (1997). Event studies in economics and finance. Journal of Economic Literature, 35(1), 13–39.
- Malaysian Investment Development Authority. (2025). Q1 2025 investment performance media release. https://www.mida.gov.my/wp-content/uploads/2025/06/FINAL_Q12025-Investment-Performance_-Media-Release.pdf
- Marzuki, M. J., & Newell, G. (2019). The emergence of data centres as an innovative alternative property sector. Journal of Property Investment & Finance, 37(2), 140–152. https://doi.org/10.1108/JPIF-08-2018-0064
- Merton, R. C. (1987). A simple model of capital market equilibrium with incomplete information. The Journal of Finance, 42(3), 483–510. https://doi.org/10.1111/j.1540-6261.1987.tb04565.x
- Microsoft. (2024, May 2). Microsoft announces US$2.2 billion investment to fuel Malaysia’s cloud and AI transformation. Microsoft News Center Asia. https://news.microsoft.com/ apac/2024/05/02/microsoft-announces-us2-2-billion-investment-to-fuel-malaysias-cloud-and-ai-transformation/
- Ministry of Economy. (2023). National Energy Transition Roadmap. https://ekonomi.gov.my/ sites/default/files/2023-08/National%20Energy%20Transition%20Roadmap.pdf
- Ministry of Investment, Trade and Industry. (2024). National Semiconductor Strategy. https://www.miti.gov.my/miti/resources/NSS_141024.pdf
- Ministry of Science, Technology and Innovation. (2024). The national guidelines on AI governance & ethics. https://mastic.mosti.gov.my/storage/ 2024/ 09/ The-national-guidelines-on-ai-governance-ethics.pdf
- Nasdaq. (2026). Nasdaq-100 Index methodology. https://indexes.nasdaq.com/docs/Methodology_ NDX.pdf
- Nashraa, A., Hashim, F. H., Balti, K., Gbla, A., Kalong, M. H. F. H., & Nizam, I. (2026). Strategic analysis case study: IHH Healthcare Berhad. Journal of Business Management and Accounting, 16(1), 103–137. https://doi.org/10.32890/jbma2026.16.1.6
- Newey, W. K., & West, K. D. (1987). A simple, positive semi-definite, heteroskedasticity and autocorrelation consistent covariance matrix. Econometrica, 55(3), 703–708. https://doi.org/10.2307/1913610
- Nyman, R., Kapadia, S., & Tuckett, D. (2021). News and narratives in financial systems: Exploiting big data for systemic risk assessment. Journal of Economic Dynamics and Control, 127, 104119. https://doi.org/10.1016/j.jedc.2021.104119
- Peng, H.-R., Zhang, Y.-J., & Liu, J.-Y. (2023). The energy rebound effect of digital development: Evidence from 285 cities in China. Energy, 270, 126837. https://doi.org/10.1016/ j.energy.2023.126837
- Saif-Alyousfi, A. Y. H. (2025). Artificial intelligence, information environment, and capital market efficiency. Research in International Business and Finance, 79, 103094. https://doi.org/10.1016/j.ribaf.2025.103094
- Shiller, R. J. (2017). Narrative economics. American Economic Review, 107(4), 967–1004. https://doi.org/10.1257/aer.107.4.967
- Su, F., & Wang, X. (2021). Investor co-attention and stock return co-movement: Evidence from China’s A-share stock market. The North American Journal of Economics and Finance, 58, 101583. https://doi.org/10.1016/j.najef.2021.101583
- Sulaiman, N. A., Lee, K. H., Shahimi, S., & Sulaiman, S. (2023). The impact of financial determinants on Malaysian REITs’ performance. Journal of Business Management and Accounting, 13(1), 1–30. https://doi.org/10.32890/jbma2023.13.1.1
- Takci, M. T., Qadrdan, M., Summers, J., & Gustafsson, J. (2025). Data centres as a source of flexibility for power systems. Energy Reports, 13, 3661–3671. https://doi.org/10.1016/j.egyr.2025.03.020
- Walter, Y. (2024). Managing the race to the moon: Global policy and governance in artificial intelligence regulation—A contemporary overview and an analysis of socioeconomic consequences. Discover Artificial Intelligence, 4, 14. https://doi.org/10.1007/s44163-024-00109-4
- Wang, Y. Z. (2025). Building accurate energy-use statistics for data centers. Global Energy Interconnection, 8(4), 101558. https://doi.org/10.1016/j.gloei.2025.101558
- White, H. (1980). A heteroskedasticity-consistent covariance matrix estimator and a direct test for heteroskedasticity. Econometrica, 48(4), 817–838. https://doi.org/10.2307/1912934
- Xu, J., Lee, T., & Goggin, G. (2024). AI governance in Asia: Policies, praxis and approaches. Communication Research and Practice, 10(3), 333–345. https://doi.org/10.1080/ 22041451.2024.2391204
- Yahoo Finance. (2026). Historical market data [Data set]. https://finance.yahoo.com
- YTL Power International Berhad. (2023, December 8). YTL to advance AI development in Malaysia in collaboration with NVIDIA. https://www.ytlpowerinternational.com/press-releases/ytl-to-advance-ai-development-in-malaysia-in-collaboration-with-nvidia/