Resources Supporting Incorporeal Assets in Continuously Traded Philippine Universal Banks
- University of Santo Tomas
Journal of Business Management and Accounting 14(2) (2024) · https://doi.org/10.32890/jbma2024.14.2.2
Abstract
The Strengthening Program for Rural Banks (SPRB) in the Philippines has allowed universal banks to purchase rural banks, and this policy highlights the possible advantages of expanding business combinations for intangible assets. Considering the SPRB, this paper examines the intangible motivation behind banks' actions to purchase capital-deficient financial institutions. This study aims to address sources of intangible assets for Philippine banks as Tobin's q measures. Using Tobin's q as a measure of intangible value allows for identifying contributing factors that determine it based on financial data. The study subjects are actively traded Philippine Universal Banks between 2009 and 2018. The influence of variables in the study on intangible asset value, as Tobin’s q measures, was determined using an Ordinary Least Squares model. Operational factors significantly influencing intangible value are investments in subsidiaries and associates, the return on assets, and bank deposits. Activities intended to reach target customers, such as those captured by marketing and advertising expenditures, positively influence intangible value. These findings imply that merely purchasing more assets does not improve the value of intangible resources. Instead, asset productivity, funds to make more loans, and informing the public of bank activities benefit intangible asset values. The implications of these findings offer insight into the sources of intangible assets that investors value.
Keywords: Tobin’s q, intangible assets, ordinary least squares regression, banking, return on assets
INTRODUCTION
The Bangko Sentral ng Pilipinas (BSP) and the Philippine Deposit Insurance Corporation (PDIC) jointly conceived the Strengthening Program for Rural Banks (SPRB) in 2009. The program was purposed to strengthen the rural bank sector by encouraging mergers, acquisitions, and consolidations using financial grants to third-party investors. These grants would help fortify the rural banking sector, helping rural banks survive, especially those with capital deficiencies. Under the program, PHP 50 billion in grants were offered to third- party investors (Kashiwabara, 2017). Between 2009 and 2018, 148 rural banks in the Philippines were liquidated (Philippine Deposit Insurance Corporation, 2023). For many liquidated rural banks in the program, buyers were other financial institutions, namely, universal banks.
Based on annual reports and data from the central bank, between 2009 and 2018, universal banks in the Philippines engaged in branch expansions to increase client bases, deposits and opportunities to cross-sell products. In 2009 the number of bank branches in the country stood at 8,620. In the following year, a 2.98 percent year-onyear growth to 8,877 branches. By 2013, the number of bank branches reached 9,935, a 5.58 percent increase from the 9,410 branches in 2012. There were 12,364 branches in 2018, which stood as a 4.84 percent annual increase from the 11,793 branches in the previous year. The 10-year compound annual growth rate of bank branches from 2009 to 2018 was 3.67 percent. Effectively, by 2018 there were 43.43 percent more physical bank branches in the Philippines than in 2009 (Bangko Sentral ng Pilipinas, 2023).
Universal banks are a class of financial institutions in the Philippines that engage in investment banking, ownership in non-financial companies, and other banking subsidiaries. Universal banks will have a more comprehensive array of business combinations than commercial banks, which focus on traditional banking services, such as deposit taking, lending, foreign exchange, and payment processing (Republic of the Philippines, 2000). With the right to own other financial institutions, the purchase of liquidated rural banks carries the advantage of expanding the business combinations of the universal bank. In optimistic terms, the purchase of a rural bank by a strategic investor, such as a universal bank, is expected to increase the intangible asset value of the buying party.
Empirical evidence alludes to the influence that intangible assets have on firm value. Indexes that measure intangible assets, such as the “Best Global Brands” (Interbrand, 2020) along with “The World’s Most Valuable Brands” (Swant, 2020), observe firm productivity (net profits or Earnings Before Interest and Taxes), brand role, and company role in its industry. Observations of monetary and qualitative aspects of firms indicate that tangible and intangible resources affect how markets value firms. As a measure of market premiums on businesses, Tobin’s q (q) is a metric that captures the value of intangible assets in the portfolio of company resources.
From the Resource Based View (RBV) of the firm, specific assets of companies (such as existing land and equipment holdings, human capital, trade secrets and patents) provide firms with competitive advantages that generate value (Barney, 1991). Considering the RBV theory, Tobin’s q serves as a measure to determine the extent of added value that impalpable assets impart above the intrinsic value of a firm. Higher metric values indicate higher intangible asset values (Lindenberg & Ross, 1981). Changes in q between periods allow for predictions on portfolio mean returns (Belo et al., 2010).
This study examines the factors that affect the value of intangible resources as possible motivations for engaging in activities aimed at purchasing assets, such as weaker financial institutions or branch licenses. The main objective of this discussion is to analyze the impact of specific resources on the market valuations of intangible assets for Philippine Universal Banks from 2009 to 2018. During this period, universal banks were encouraged to purchase distressed rural banks under the Strengthening Program for Rural Banks, a joint program of the Philippine Central Bank and the PDIC. From annual reports of cohorts, this period witnessed aggressive expansions in branch networks, from 8,620 branches in 2009 to 12,364 by 2018, a 43.4% growth. Investigations in this study examine factors such as investments in subsidiaries and branch licenses, bank marketing expenditures, deposit levels, and the productivity of assets in generating net income (the return on assets). The study examined the Parent Companies of Philippine Universal Banks, whose shares traded continuously on the Philippine Stock Exchange (PSE) from 2009 to 2018. The sample of firms excluded banks whose declarations aggregated performance as a group due to comparison issues. Due to data continuity issues, the researchers excluded banks that started trading in the stock exchange after 2009.
Subsequent sections of this paper will provide discourse on the theoretical background of Tobin’s q and findings from the sample of firms. The second section of this article will addresses the developments in studies of Tobin’s q. The third section is an explanation of data gathering and analysis methodologies. A fourth section will describe the findings from analyses of sample firms and offer associated discussions. The final section concludes this article.
REVIEW OF RELATED LITERATURE
Investigations into the relationship between market valuations and book values of resources receive exposition by Tobin (1969 and 1977). In the 1969 paper by Tobin, the supply of money is a factor in market asset valuations. The supply of money is a resource that allows a firm to acquire new assets, which augments company productivity. The portfolio of assets yields a specific rate of return, a marginal capital efficiency. This firm-specific rate of return receives assessment relative to the market rate of return, effectively a hurdle rate. Tobin’s q relates the market rate of return to the mean marginal efficiency from a portfolio of assets. Values of q less than unity (below 1) indicate a state of marginal capital efficiency less than the required market rate of return. This condition does not induce investment. Tobin (1977) examines predicates of company overvaluations by the market and their implications. The q metric is a ratio that relates the value of firm assets by the market and their book values. In a state of unity (where q equals 1), the asset book value (or replacement costs) occurs at the same economic growth rate. Where the metric is greater than unity, a state of profits exists exclusive to a firm (monopoly profits), and a company can extract rents for the use of its assets. Companies that have q values higher than one have the ability to offer products or processes that could make the resources of other firms within the same industry outdated. In states greater than unity, the market imparts greater value to the portfolio of company assets, which serves as the market premium. This additional value on the combination of firm resources receives attribution as the market discount rate, or the investment rate of return.
Tobin (1969) expounded on how money supply affects the market valuations of assets. Of the prominent assumptions in the seminal paper is that a relationship exists between the asset growth rate and the rate of growth in wealth. Private assets, in the paper, are a form of private wealth. A portfolio, a collection of assets, produces a specific rate of return. To evaluate investments, the market rate of return provides the hurdle rate and the discount rate for valuation. An inverse relationship between quantity and the yield from physical capital receives explication. This relationship results from the demand for money and fixed assets. As to the relationship between money and tangible assets, the paper forwards that a link exists between capital marginal efficiency (R) and the market-required rate of return (q). The q value relates the cost of capital and its mean marginal efficiency. When q arrives at values of less than one, the rate of return from an investment is less than the cost of capital. In this disequilibrium condition, capitalists do not exhibit an inclination to invest. From the paper, q (the market required rate of return) results from the supply of money and government securities, the covariance between money and securities, Treasury rates, income, the marginal efficiency of capital, prices, and inflation. Treasury rates, income, and prices are factors with inverse relationships to q.
In a later paper, Tobin (1977) discussed the factors that affect market overvaluation and their implications. The discussion argues that the relation between market and book values for assets is analogous to the rate for investing. In the discourse, a q ratio describes the relationship between market prices on firm assets and their replacement costs (book values for those assets). With a q value of one, unity, capital replacement occurs at the same rate as economic growth. In other words, the value of assets increases in equilibrium with economic growth. If q exceeds one, a capitalization of rents and monopoly profits transpires. The occurrence of events, programs, strategies, and beliefs in the short-term creates or destroys investment premiums. The paper forwards that the market discount rate necessitates the passage of time and risks of firm cash flows. Determinants of q are aspects of monetary policy, bank deposit rates, short-term commercial papers (unsecured promissory notes), lending rates, treasury security rates, inflation, loan portfolio amounts, the reserve rate, the policy rate, and commercial bond yields. At the firm level, q for a specific investment is a primary concern rather than its value for the entire economy. Specific q values for a firm that differ from the industry average indicate novel procedures or products that render existing assets in the industry obsolete.
Factors that affect company rates of return emerge from firm-specific assets and public perceptions. In discussing the influence of customer satisfaction ratings on company valuations, Anderson, Fornell, and Mazvancheryl (2004) stated that a positive relationship exists between these factors. Aspects such as industry concentration, market share, and the ratio of advertising expenditures to sales serve as control variables in testing the significance of influence customer satisfaction has on Tobin’s q. From the Ordinary Least Squares (OLS) regression model of the paper, there exists an indication that customer satisfaction increases q values. A Bayesian regression model further supports the finding on the influence of customer satisfaction. Qualitative information regarding company philanthropy and reputation risk also positively influences relationships with market valuations, as Tobin’s q measures (Hogarth, Hutchinson, and Scaife, 2016).
A company’s competitive advantage is affected by Goodwill along with activities in research and development, including advertising (Villalonga, 2003). An examination of firm rates of returns by Villalonga (2003) highlights the influence of intangible assets. Expenses that record resources producing intangible assets are research and development, advertising, and other intangibles-in-book (Goodwill is an example). An OLS model proves that these intangible asset-producing resources affect a company’s competitive advantage.
Firm productivity, brand equity, human capital, and growth prospects are some examples of intangible assets (Eberhart et al., 2008; Vomberg, Homburg and Bornemann, 2014; Niu, 2016; Bhatia and Aggarwal, 2018). Eberhart et al. (2008) treat Tobin’s q as a gauge of company growth prospects. Technological and research and development factors also affect the market valuations of companies. Resources such as expenditures in research and development and total assets are factors with correlations to market value (Chen & Chang, 2010). Vomberg et al. (2014), in their discussion of the effects of brand equity and human capital on Tobin’s q, find that the productivity of assets (return on assets) is an influential factor. In an investigation of banks, productivity metrics influence the market valuations as the q value measures (Niu, 2016; Bhatia and Aggarwal, 2018). The loan portfolio growth rate and productivity ratios influence company value (Niu, 2016).
Lev (2004) discusses methods by which to account for intangibles in firms. The article assumes that company earnings result from assets (both physical and financial) that intangible assets (i.e. human skill, processes, and the like) exploit during business. The paper distinguished between the expense mindset and the asset mindset in looking at intangibles. According to Generally Accepted Accounting Principles treatment, companies must immediately expense internally generated intangibles. The value of intangibles-driven earnings results from the difference between company earnings and the proportion of physical assets contributing to net income. The industry average return on physical assets is the multiplier to firm-specific physical assets in determining the amount of fixed assets that contribute to earnings. Intangible capital value is the net present value of intangibles-driven earnings. Determining comprehensive value is necessary to compare firm-specific value to its market value. Comprehensive value results from the sum of balance sheet accounts attributable to financial and physical assets and intangible capital value. Further, the article argues that fuller disclosure of information regarding intangibles lowers stock price volatility and bid-ask spreads for shares.
Austin (2007) discussed the standards and implications of International Accounting Standard (IAS) 38 Accounting for Intangible Assets. Incorporeal assets must be separable from other firm assets or may arise from legal or contractual rights. Intangible assets are attributes of firm balance sheet assets. According to IAS 38, intangible assets for a firm may result from purchases, internally generated projects, asset exchanges, or as part of a combination of businesses (International Financial Reporting Standards, 2017). Activities in research and development by firms internally generate intangible assets. Intangible resources recognizable under IAS 38 relate to marketing (such as trademarks, mastheads, website domain names and agreements of non-competition); customer segments (customer lists, contracts with customers, as well as non-contractual relationships with customers); copyrights; contracts (licenses, job orders, leases, permits, franchises); and patents or trade secrets.
International Financial Standards 3 addresses accounting for business combinations. The concept of Goodwill arises from business combinations that emerge from acquiring another company. Costs whose attribution is not traceable to identifiable assets of an acquired firm receive recognition as Goodwill. Differences between acquired firm assets and liabilities and its purchase price receive immediate recognition as either financial gain or loss (International Financial Reporting Standards, 2008). Goodwill, by definition, is incorporeal and exists outside of tangible assets, which classifies its existence as a form of intangible asset.
Chung and Pruitt (1994) forwarded a simplified calculation of Tobin’s q with an explanatory power of 96.6 percent of the Lindenberg and Ross (1981) method. The q value approximation results from market prices for common and preferred shares of a firm, the value of short- term debt, net of current assets, and total assets book value. Ordinary Least Squares regressions between approximated Tobin’s q and the Lindenberg and Ross (1981) method indicate standard errors that ranged from below 7.3 percent to 4 percent of values from the earlier method. For individual firms, differences between the two techniques range from 9.3 to 18.1 percent from the 1981 method.
Ishaq et al. (2021) conducted a study to discuss the validity of Tobin’s q as a measure of firm performance. The study examined 51 Pakistani firms in the manufacturing sector whose shares traded in the Pakistan Stock Exchange from 2012 to 2016. The relationship between Tobin›s q values and metrics that capture scale efficiency and cost discipline was analyzed. Chung and Pruitt (1994) approximated Tobin›s q values by using the book value of total assets, the market value of equity, and the book value of equity. The study found that scale efficiency and cost discipline exhibit statistically significant relationships with Tobin›s q values. The study found that Tobin›s q values had a positive and statistically significant relationship with the gross profit ratio. In contrast, the operating expense ratio had a negative and statistically significant relationship.
The first hypothesis observes statements from Lev (2004) where firm performance results from intangible resources that enable physical and financial assets. Lev (2004) attributes expenditures in information technology to intangible capital. According to Austin (2007), IAS 38 identifies purchases, projects, and business combinations as sources of intangible assets. Thus, this study tests the significance of Bank Investments in Subsidiaries and Associates to influence intangible value, as Tobin’s q captures.
Hypothesis 1: Bank Investments in Subsidiaries and Associates, reflecting value from business combinations, are statistically significant in influencing intangible value as Tobin’s q captures.
The study conducted by Niu (2016) aimed to determine the factors that affect bank valuations measured by Tobin’s q. The study analyzed 15,887 American banks from 2002 to 2013, and the models used OLS regression analysis to determine bank valuations based on loan growth, abnormal loan growth, bank size, capital, loans, deposits, asset diversity, and control variables. The study found that the proportion of equity in the capital structure significantly influences Tobin’s q values. The study also found that loan growth and deposits significantly influence Tobin›s q values for banks with total assets below USD1 billion. In contrast, loan growth had the most significant impact on banks with assets greater than USD 1 billion and less than USD 10 billion. For large banks with assets exceeding USD 10 billion, the proportion of equity in the capital structure was the most influential factor.
Intangible asset values and return on assets have a positive and significant relationship (Vizcaìno and Chousa, 2015; Angurah and Amalia, 2020). A paper by Vizcaíno and Chousa (2015) examined the impact of board votes and other firm-specific metrics on Tobin’s q. The authors consider Tobin’s q as a measure of what the market is willing to pay for a firm›s total assets, both tangible and intangible. Tobin›s q provides information that explains the present value of future cash flows of the firm in a condition where markets are efficient. The paper includes several other metrics in the models, including the leverage ratio, return on equity, return on assets, the price-to-earnings ratio, the multiple of equity book value to meet market capitalization for a firm, and dividends as a proportion of market capitalization. Of the findings in the paper, the return on assets is the most influential and significant determinant of Tobin’s q. Data on 61 manufacturing firms traded on the Indonesia Stock Exchange, Anugrah and Amalia (2020) find Tobin’s q values have statistically significant relationships with return on assets and stock price. Additionally, sales growth has a significant relationship with Tobin’s q values. From these findings, the paper concludes that management and the creation of intangible assets improve company performance and firm market value.
A study by Mamun et al. (2021) investigated the impact of intangible assets resulting from mergers and acquisitions on the market value of firms. The research analyses 1,607 American public firms between 1993 and 2014 using the event study methodology by Brown and Warner (1980). The Tobin’s q value of the target firm shows a statistically significant relationship with abnormal announcement returns when a company acquires it. There is an inverse relationship between Tobin’s q values as announcement returns of the acquiring firm decrease, indicating the search for undervalued targets whose intangible assets still need to be recognized by the market.
The second hypothesis reflects findings from the extant literature that the productivity of assets is influential in market valuations of intangible values. Lev (2004) proposed that the return on investments in physical assets and human resources is a measure to gauge firm productivity as intangible resources enable tangible and financial assets. A conceptual relationship appears between resource intangibility and firm-specific profitability as the return on assets describes (Villalonga, 2004; Vomberg, Homburg, and Bornemann, 2014; Hogarth, Hutchinson and Scaife, 2016; Niu, 2016; Vizcaino and Chousa, 2016; Bhatia and Aggarwal, 2018). This study tests the significance of the return on assets in influencing intangible value in the Philippine banking environment.
Hypothesis 2: The return on assets is statistically significant as an influential factor in market valuations of intangible assets for cohorts in the sample.
A third hypothesis of this study examines the availability of funds for banks in the sample to affect Tobin’s q values. Bank deposits serve as the funds for investments, conceptually akin to the availability of funds argument from Tobin (1977). Niu (2016) shows that bank deposits statistically significantly influence intangible value for banks with total assets up to USD 1 billion. For the cohorts in the sample, this study tests for deposits as a significant factor influencing Tobin’s q.
Hypothesis 3: Bank deposits are statistically significant in affecting market valuations of intangible assets for cohorts in the sample.
In a study of 196 publicly traded, non-financial firms in Pakistan, Butt, Baig, and Seyyed (2021) found marketing expenditures a statistically significant factor in determining intangible asset values. The study covers firms from 14 industries, ranging from textiles to food products and other services and activities. Predictor variables in the study are marketing spending, market capitalization, liquidity per share, degree of long-term leveraging to total assets, operating margin, and asset growth.
Lev (2004) attributes marketing expenses to brand enhancement, while the American Finance Association (2014) suggests that companies engaging in substantial advertising activities should have higher Tobin’s q values based on an interview with Stephen Ross. Considering statements indicating the relationship between marketing expenses and intangible assets, this study seeks to determine if marketing expenses are influential in affecting Tobin’s q for firms in the sample.
Hypothesis 4: Marketing expenses are statistically significant influences that affect the valuation of intangible assets by the market for firms in the sample.
METHODOLOGY
Studies approximating Tobin’s q calculate its value from market prices and book values for a company. Chung and Pruitt (1994) approximate q values using market prices for common and preferred shares, level of short-term liabilities, net of current assets, and the book value for total assets (TA). Compared to the Lindenberg and Ross (1981) method, which also requires information on a price index for capital goods, the Chung and Pruitt (1994) methodology uses account classes evident in company financial reports to estimate
Tobin’s q. Values from the Chung and Pruitt (1994) method exhibit standard errors ranging from 7.3 percent to 4 percent using an OLS method compared to the Lindenberg and Ross (1981) process. In this study, the Chung and Pruitt (1994) method was used to estimate Tobin’s q values.
Following the Chung and Pruitt (1994) methodology, short-term liabilities are current liabilities payable within a year. Short-term assets (SA) are current assets held for only a year. The calculation of debt is the difference resulting from short-term liabilities less current assets added to long-term debt. This concept of debt is effectively a special case of net debt. Calculating net debt involves adding current and non-current debt, net of cash, and cash equivalents. Negative net debt indicates a cash position where the firm can meet short- and long- term liabilities and experience a remaining surplus of cash (Corporate Finance Institute, 2021).
The statistical model in this study utilizes an OLS regression technique to determine the influence of independent and control variables on market valuations of intangible assets. This analysis method follows studies by Eberhart, Maxwell and Siddique (2009), Bessen (2009), Vomberg, Homburg, and Bornemann (2014), Hogarth, Hutchinson and Scaife (2016), Niu (2016), and Bhatia and Aggarwal (2018). Analyses utilize the nlme package in the R Statistics environment (Linear and Nonlinear Mixed-Effects Models, Version 3.1-152, Pinheiro et al., 2021). Data visualizations for this study utilize the ggplot2 package in R (Elegant Graphics for Data Analysis, Version 3.3.3, Wickham, 2016).
From 2009 to 2018, the Philippine Stock Exchange continuously traded the eight Philippine Universal Banks, which are the subjects of this study. Data comes from Annual Reports for each of the firms in the sample. The study uses annual reports from investor relations pages for each cohort in the sample. Further, information from Security and Exchange Commission (SEC) Form 17-A offers data for cohorts when specific years were unavailable on their investor relations websites. Data in SEC Form 17-A exists as hardcopies that the SEC delivers via the SEC Express Service at a per-page rate.
Variables that affect Tobin’s q for cohorts in the sample are resources that encompass tangible assets and marketing activities for which a firm has control. Bank Investments in Subsidiaries and Associates
(BIS) envelop parent company activities in the acquisitions of other banks, Goodwill (from acquisitions), software costs, and branch licenses. Effectively, investments in subsidiaries and associates capture the value of business combinations. Parent company returns on assets (ROA) capture the productivity of total assets (by book value) to generate net income. Bank Deposits (BD) are resources that are conceptually like the supply of funds by Tobin (1969 and 1977); this is a balance sheet account. Bank deposits are a substantial proportion of bank assets, and serve as the source from which loans are made. Bank Marketing Expenditures (BME) receive treatment expense accounts attributing to activities in advertising and publicity, effectively brand building. All monetary values receive transformation using the natural logarithm technique.
External variables in the study are exogenous factors that particular extant literature attribute as influencing Tobin’s q. Racicot and Théoret (2016) supported that investment occurs until the marginal cost equals the marginal benefit, as Tobin’s q captures. In an explication of the Fung and Hsieh (1997) seven-factor model, bond rates (T-BILL) serve as factors that affect the marginal benefit of an investment for investment funds (Racicot and Théoret, 2016). Tobin (1969) attributed inflation (INF) as a factor that influences the supply of funds, which affects the demand for assets. The corresponding author can provide the data sets used for these analyses upon reasonable request.
| Variables | Reference |
|---|---|
| Dependent Variable (Tobin's q): | |
| Firm Share Price | Chung and Pruitt (1994) |
| Outstanding Common Stock | Chung and Pruitt (1994) |
| Short-term Liabilities | Tobin (1977); Chung and Pruitt (1994); Niu (2016) |
| Short-term Assets | Tobin (1977); Chung and Pruitt (1994); Niu (2016) |
| Long-term Debt Book Value | Tobin (1977); Chung and Pruitt (1994); Niu (2016) |
| Total Assets Book Value | Chung and Pruitt (1994) |
| Independent Variables (Firm-specific): | |
| Bank Investments in Subsidiaries and Associates | Lev (2004) |
| Return on Assets | Tobin (1977); Lev (2004); Villalonga (2004); Vomberg, Homburg, and Bornemann (2014); Hogarth, Hutchinson and Scaife (2016); Vizcaìno and Chousa (2015); Bhatia and Aggarwal (2018); Anugrah and Amalia (2020) |
| Bank Deposits | Niu (2016) |
| Bank Marketing Expenses | Lev (2004); American Finance Association (2014); Butt, Baig, and Seyyed (2021) |
| Control Variables (External): | |
| Treasury Bond Rates | Tobin (1969); Racicot and Théoret (2016) |
| Inflation | Tobin (1969) |
RESULTS AND DISCUSSION
Regarding bank size and deposit levels, from the summary statistics in Table 2, it becomes apparent that there was an uneven distribution of assets among banks in the sample. For cohorts in the sample, total assets range from PHP 104.2 billion to PHP 2,891 billion. Take notice that the minimum asset level is about one standard deviation from the mean, and the maximum value is 3.65 standard deviations. The evidence indicated that sample subjects do not have an equal distribution of resources. The range of Bank Deposits (BD) varies between PHP 108.8 billion and PHP 2,362.3 billion, with a standard deviation of PHP 479.9 billion, which supports the observation of unequal resource distribution. The minimum deposit level is about one standard deviation from the mean, while the maximum is 3.7 standard deviations from the mean. The substantial standard deviation in deposits indicates their concentration at the larger banks rather than being evenly distributed among all cohorts in the sample.
When we compare asset sizes and deposits of banks in the sample to the entire Universal and Commercial Banking Group, we can further see the concentration of resources. In 2018, the total assets of banks in the sample comprised 66.17 percent of tangible resources in the banking group, as the BSP identifies. Banks 1, 2 and 3 have aggregated asset values that comprise nearly two-fifths (42.96 percent) of total assets for Universal and Commercial Banks in 2018 (BSP, 2018, Ranking as to Total Assets: Universal and Commercial Bank Group, As of December 31, 2018). In relation to sample subjects, these same three banks account for nearly five-eights (64.92 percent) of assets. Table 3 describes Total Asset values in 2018 for subjects in the study.
Bank Investments in Subsidiaries and Associates (BIS) range from PHP 887 million to PHP 45,086 million. These investments exhibit a standard deviation of PHP 11,904 million. The Bank Marketing Expenses (BME) range from PHP 15.2 million to PHP 4,208 million, and the standard deviation is PHP 811.7 million, suggesting that some groups are more proactive in brand building than others.
As the ROA captures, asset productivity ranges from 0.5 percent to 4.95 percent, with a standard deviation of 0.76 percent. The least productive rate is 1.32 standard deviations from the mean, while the most productive is 4.54 standard deviations. Banks with smaller asset levels may have higher productivity rates, as Banks 7 and 8 evidenced in Figure 2. Since 2015, the three largest banks in the sample (Banks 1, 2 and 3) experienced asset productivity rates lower than the 10-year average.
| Statistic | Min. | Mean | Max. | St. Dev. |
|---|---|---|---|---|
| TA | 104,274 | 745,561 | 2,891,812 | 588,139 |
| BD | 108,821 | 589,438 | 2,362,302 | 479,946 |
| BIS | 887 | 13,416 | 45,086 | 11,904 |
| ROA | 0.005 | 0.015 | 0.0495 | 0.0076 |
| BME | 15.2 | 648.8 | 4,208 | 811.656 |
| T-BILL | 0.0072 | 0.0274 | 0.0514 | 0.0138 |
| INF | 0.007 | 0.0321 | 0.052 | 0.0136 |
| Tobin's q | -0.55 | 0.192 | 1.03 | 0.3219 |
Note: All values in PHP Millions, in exception of ROA, T-BILL, INF and Tobin’s q. TA: Total Assets Book Value; BD: Bank Deposits; BIS: Bank Investments in Subsidiaries and Associates; ROA: Return on Assets; BME: Bank Marketing Expenses; T-BILL: BSP 364-day Treasury Bill; INF: Annual Average Inflation Rate.
| Symbol | Total Assets |
|---|---|
| Bank 1 | 2,891,812 |
| Bank 2 | 1,863,664 |
| Bank 3 | 1,753,141 |
| Bank 4 | 911,801 |
| Bank 5 | 778,253 |
| Bank 6 | 602,236 |
| Bank 7 | 511,355 |
| Bank 8 | 510,923 |
Note: All values in PHP Millions. Bank names are masked.
During the observation horizon from 2009 to 2018, deposits were a substantial proportion of total assets for cohorts in the sample. Figure 1 describes the trend relationship between deposits and total assets. Banks 2, 4 and 8 had their proportion of assets as deposits lower than the 10-year average and exhibited lower than average asset productivity. Bank 6 embarked on an aggressive digitization of banking processes in 2016 (Manning, 2017), improving asset productivity from a downward trend between 2012 and 2015. Figure 2 shows the proportion of deposits to total assets and the return on total assets exhibited lowerfor thancohorts in productivity. average asset the sample. Bank 6 embarked on an aggressive digitization of banking processes in 2016 (Manning, 2017), improving asset productivity from a downward trend between 2012 and 2015. Figure 2 shows the proportion of deposits to total assets and the return on Figure 1 for cohorts in the sample. total assets
The figure itself is in the PDF version.
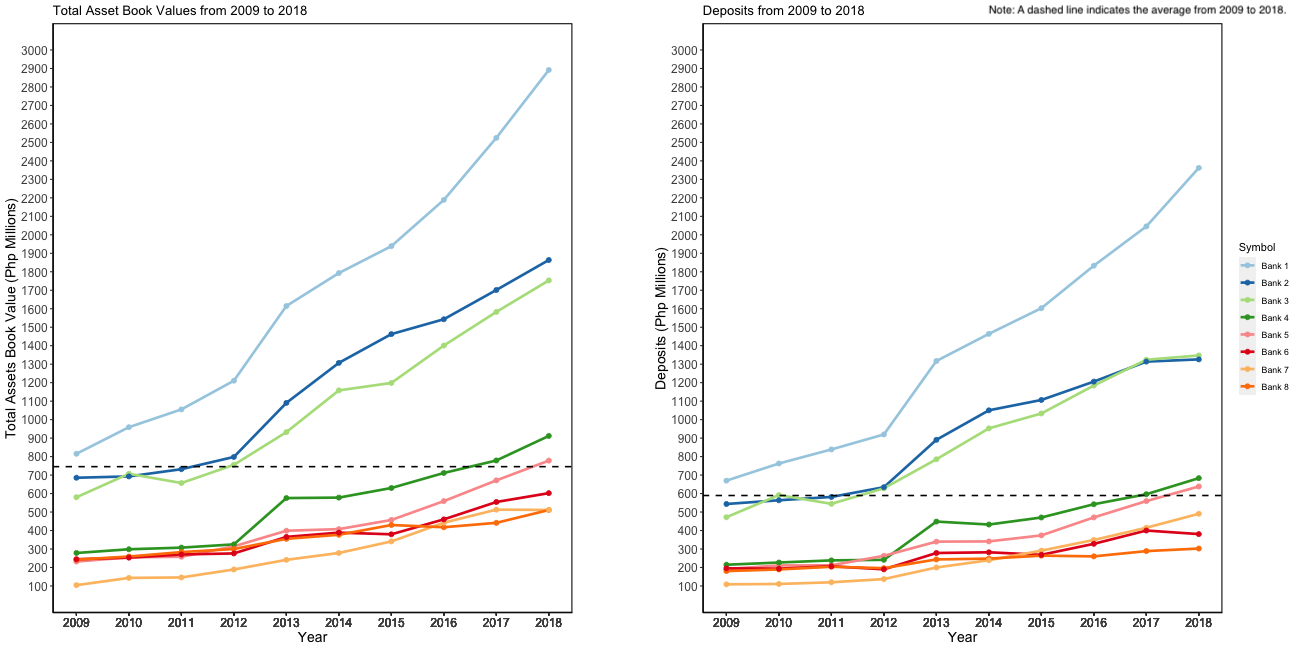
is greater than the 10-year average. These banks ‘ market valuations of intangible assets are greater than the mean for all cohorts. From 2009 to 2014, Banks 2 and 3 had above-average deposits in their total assets, which coincides with Tobin’s q values being greater than the 10-year average for all cohorts. Figure 3 describes the 10-year trends in Tobin’s q values for study subjects. The single dashed line crosses the y-axis at zero (0). The double dashed line is the 10-year Tobin’s q average, 0.192.

More than any of the other variables in the study, asset productivity, as the return on assets measures, is statistically significant as an influence on Tobin’s q values. Hence, the evidence supported Hypothesis 2. The market greatly valued asset productivity and rewards cohorts in the sample for generating profits given available resources. This finding was in consonance with Villalonga (2004), Vomber, Homburg, and Bornemann (2014), Hogarth, Hutchinson and Scaife (2016), Niu (2016), Vizcaìno and Chousa (2016), and Bhatia and Aggarwal (2018).
From regression estimates, the supply of funds for investment as Bank Deposits (BD) capture is significant in influencing market valuations of intangibles at the 95 percent confidence level. Hypothesis 3 receives support from this finding. As deposits increased, the market rewarded intangible asset values for banks in the sample. This finding is consistent with statements by Niu (2016) indicating the significance of bank deposits in affecting intangible bank asset values.
In consonance with existing notions about the relationship between branding and intangible assets (Lev, 2004; American Finance Association, 2014), Bank Marketing Expenditures (BME) are statistically significant at a 95 percent confidence level, supporting Hypothesis 4. Valuations of intangible assets by the market benefited from activities in brand building and advertising for cohorts in the sample.
| Variables | Coefficient | p-value |
|---|---|---|
| BIS | -0.16399 | 0.0008 |
| ROA | 16.03882 | 0.0026 |
| BD | 0.16967 | 0.0072 |
| BME | 0.08680 | 0.0366 |
| T-BILL | 4.63544 | 0.1050 |
| INF | -2.20906 | 0.4534 |
| (Intercept) | -1.96195 | 0.1098 |
Note: Tobin’s q is the dependent variable. The period of observation is from 2009 to 2018. BIS: Bank Investments in Subsidiaries and Associates; BME: Bank Marketing Expenditures; BD: Bank Deposits; ROA: Return on Assets; T-BILL: 364-day BSP Treasury Rate; INF: Inflation.
CONCLUSION
In this discussion on intangible assets for a series of openly traded Philippine Universal Banks, Tobin’s q measured market valuations of intangible resources. The Resource Based View was a theoretical guide in conceptualizing sources of intangible assets as contributors to competitive advantage. Tobin’s q allows for determining added value above the firm intrinsic value. Higher levels of the q metric indicate greater intangible asset values (Lindenberg & Ross, 1981). This study observed the influence intangible assets exert on market values for Philippine Universal Banks.
The cohorts in this study were the parent companies of Philippine Universal Banks with shares continuously traded on the Philippine Stock Exchange for the 10-year years from 2009 to 2018. During this observation horizon, the BSP and PDIC collaborated on a joint program to encourage the acquisition of distressed rural banks. Universal banks bought many of the distressed rural banks. Additionally, many banks in the country sought to reach customers by expanding bank branch networks. Considering government policy during this horizon of observation, this study investigated the possible motivations of a bank to purchase a capital-deficient financial institution and acquire more physical assets to reach potential clients.
This paper analyzed how a bank’s worth is influenced by factors such as advertising expenses, investments, and profits. Interestingly, the results revealed that investing in other subsidiaries and expanding physical branch networks may actually decrease a bank’s worth due to the high costs and risks involved.
The research found that banks that generate higher profits typically possess intangible assets such as brand recognition and customer trust, which add significant value. As a result, banks that earn greater profits tend to be worth more. Additionally, the research indicated that banks with more customer deposits have more opportunities to invest and increase their earnings. Finally, it was found that investing in advertising and marketing efforts can help attract more customers and ultimately increase a bank’s worth.
As this study was limited in the number of comparable subjects and the horizon of observation, future research may embark on investigations as to determinants of intangible asset values for all banks in the financial sector of the Philippine Stock Exchange. The financial sector in the local bourse is composed of universal, commercial, and thrift banks. Further, subsequent research into the predicates of intangible value may examine the influence of human and structural capital, as the Value-Added Intellectual Capital metric captures.
ACKNOWLEDGMENT
This study did not receive grant funding and was financed entirely by the corresponding author.
References
- American Finance Association. (2014). Masters of Finance: Stephen Ross. https://youtu.be/tKIwXnVEjWM
- Anderson, E. W., Fornell, C., & Mazvancheryl, S. K. (2004). Customer satisfaction and shareholder value. Journal of Marketing, 68(4), 172–185. https://doi.org/10.1509/jmkg. 68.4.172.42723
- Barney, J. (1991). Firm resources a sustained competitive advantage. Journal of Management, 17(1), 99-120. https://doi.org/10.1177/014920639101700108
- Bangko Sentral ng Pilipinas. (2018). Ranking as to Total Assets: Universal and Commercial Bank Group, As of December 31, 2018 (HTM file; 34 kb). Statistics - Banking Financial Statements.https://www.bsp.gov.ph/SitePages/Statistics/ BSFinancialStatements.aspx?TabId=3; Accessed 03/05/21
- Bangko Sentral ng Pilipinas. (2023). Regional Distribution of Banking Offices.https://www.bsp.gov.ph/Statistics/Banking%20Statistic +s/Physical%20Network/2%20historical.xls
- Belo, F., Xue, C., & Zhang, L. (2010). Cross-sectional Tobin’s Q. Working Paper 16336. NBER Working Paper Series. https://doi.org/10.3386/w16336
- Bessen, J. (2009). Estimates of patent rents from firm market value. Research Policy, 38(10), 1604-1616. https://doi.org/10.1016/j. respol.2009.09.014
- Bhatia, A., & Aggarwal, K. (2018). Impact of investment in intangible assets on corporate performance in India. International Journal of Law and Management, 60(5), 1058-1073. https://doi.org/10.1108/ IJLMA-05-2017-0127
- Chen, Y. S., & Chang, K. (2010). The relationship between a firm’s patent quality and its market value - The case of US pharmaceutical industry. Technological Forecasting and Social Change. 77(1), 20-33. https://doi.org/10.1016/j. techfore.2009.06.003
- Chung, K. H., & Pruitt, S. W. (1994). A Simple Approximation of Tobin’s q. Financial Management, 23(3), 70-74. https://doi.org/10.2307/3665623
- Corporate Finance Institute. (2021). Net Debt. https://corporatefinanceinstitute.com/resources/knowledge/finance/ net-debt/
- Eberhart, A., Maxwell, W., & Siddique, A. (2008). A reexamination of the tradeoff between the future benefit and riskiness of R&D increases. Journal of Accounting Research, 46(1), 27-52. https://doi.org/10.1111/j.1475-679X.2007.00264.x
- Fung, W. & Hsieh, D. A. (1997). Empirical characteristics of dynamic trading strategies: The case of hedge funds. Review of Financial Studies, 10(2), 275–302. https://doi.org/10.1093/rfs/10.2.275
- Hogarth, K., Hutchinson, M., & Scaife, W. (2016). Corporate philanthropy, reputation risk management and shareholder value: A study of Australian corporate giving. Journal of Business Ethics, 151(2), 375-390. DOI 10.1007/s10551-016-3205-8
- Interbrand. (2020). Best Global Brands 2020: Methodology. https://interbrand.com/thinking/best-global-brands-2020-methodology/#:~:text=Interbrand’s%20brand%20 valuation%20methodology%20seeks,delivering%20even%20 further%20growth%20tomorrow
- International Financial Reporting Standards. (2008). IFRS 3 Business Combinations. https://www.ifrs.org/issued-standards/list-of-standards/ifrs-3-business-combinations/
- International Financial Reporting Standards. (2017). IAS 38 Intangible Assets. https://www.ifrs.org/issued-standards/list-of-standards/ ias-38-intangible-assets/
- Ishaq, M., Islam, Y., & Ghouse, G. (2021). Tobin’s Q as an indicator of firm performance: Empirical evidence from manufacturing sector firms of Pakistan. International Journal of Economics and Business Administration, IX(1), 425-441. DOI:10.35808/ ijeba/683
- Kashiwabara, C. (2017, March 1). Rural bank mergers/consolidations in the Philippines: A preliminary study. Institute of Developing Economies (IDE-JETRO). https://ir.ide.go.jp/api/records/48864
- Lev, B. (2004). Sharpening the intangibles edge. Harvard Business Review, 6, 109-116. https://hbr.org/2004/06/sharpening-the-intangibles-edge
- Lindenberg, E. B., & Ross, S. A. (1981). Tobin’s q Ratio and Industrial Organization. The Journal of Business, University of Chicago Press, 54(1), 1-32. https://econpapers.repec.org/scripts/redir. pf?u=http%3A%2F%2Fdx.doi.org%2F10.1086%2F296120;h =repec:ucp:jnlbus:v:54:y:1981:i:1:p:1-32
- Manning, J. (2017, June 12). UnionBank’s Digital Revolution. International Banker: Authoritative Analysis on International Banking. https://internationalbanker.com/banking/unionbanks-digital-revolution/
- Niu, J. (2016). Loan growth and bank valuations. Quarterly Review of Economics and Finance. http://dx.doi.org/10.1016/j. qref.2016.02.001
- Philippine Deposit Insurance Corporation. (2023, September 30). Banks Under PDIC Liquidation. [PDF]. https://www.pdic.gov. ph/files/banks_under_liquidation.pdf
- Pinheiro, J., Bates, D., DebRoy, S. & Sarkar, D. (2021). R Core Team nlme: Linear and Nonlinear Mixed Effects Models. R package version 3.1-152. https://CRAN.R-project.org/package=nlme
- Racicot, F. É., & Théoret, R. (2016). The q-factor model and the redundancy of the value factor: An application to hedge funds. Journal of Asset Management, 17(7), 526-539. http://dx.doi. org/10.20381/ruor-926
- Republic of the Philippines. (2000). General Banking Law. Republic Act No. 8791. Bangko Sentral ng Pilipinas. https://www.bsp. gov.ph/Regulations/Banking%20Laws/gba.pdf
- Swant, M. (2020, July 27). Apple, Microsoft and Other Tech Giants Top Forbes’ 2020 Most Valuable Brands List. Forbes. https://www. forbes.com/sites/martyswant/2020/07/27/apple-microsoft- and-other-tech-giants-top-forbes-2020-most-valuable-brands-list/?sh=2b3d82be3ada
- Tobin, J. (1969). A general equilibrium approach to monetary theory. Journal of Money, Credit and Banking, 1(1), 15-29. https://doi.org/10.2307/1991374
- Tobin, J. (1977). Monetary Policies and the Economy -- The Transmission Mechanism, Cowles Foundation Discussion Papers 456, Cowles Foundation for Research in Economics, Yale University. https://elischolar.library.yale.edu/cowles-discussion-paper-series/688
- Villalonga, B. (2003). Intangible resources, Tobin’s q, and sustainability of performance differences. Journal of Economic Behavior and Organization, 54(2), 205-230. doi:10.1016/j.jebo. 2003.07.001
- Vizcaíno, M., & Chousa, J. P. (2015). Analyzing the influence of the funds’ support on Tobin’s q using SEM and fsQCA, Journal of Business Research, 69(6), pages 2118-2124. https://doi.org/10.1016/j.jbusres.2015.12.018
- Vomberg, A., Homburg, C., & Bornemann, T. (2014). Talented people and strong brands: The contribution of human capital and brand equity to firm value. Strategic Management Journal, 36(13), 2122–2131. https://doi.org/10.1002/smj.2328
- Wickham, H. (2016). ggplot2: Elegant Graphics for Data Analysis. Springer-Verlag New York. ISBN 978-3-319-24277-4, https://ggplot2.tidyverse.org