Analysis of the Effect of Compensation, Work Period on Employee Motivation at HR Division PT TIMAH Tbk
- Faculty of Economics, Universitas Bangka Belitung
Journal of Business Management and Accounting 14(1) (2024) · https://doi.org/10.32890/jbma2024.14.1.6
Abstract
This abstract presents a significant study focusing on employee motivation and its impact on the HR Division of PT TIMAH Tbk. The emphasis on the importance of quality human resources as prime movers for company success is commendable. The research's quantitative data analysis using regression and hypothesis testing with SPSS ensures robust findings. Excited to see the presentation as it will shed light on how compensation factors and work period influence employee motivation, with the potential to positively impact the progress and productivity of the company. The study's practical implications, urging companies to consider compensation and work period when calculating employee rewards, will undoubtedly contribute to enhancing employee motivation and overall organizational performance. This research is a valuable addition to a conference program.
Keywords: Compensation, work period, motivation
INTRODUCTION
An organization has various kinds of instruments for achieving its goals. These instruments include natural resources (raw materials), human resources (labor), technology and capital. But the most important instrument is actually human resources, where humans are the most important driving factor on the wheels of the organization. Human Resources have an important role in the organization, especially in achieving targets within a company. The role of human resources is a support for the organization that is based on the expertise and competence possessed. If the perfection and update of a system are not supported by competent human resources, then it will not produce optimal results. Therefore, human resources are an important element in an organization that must be managed properly through planning, directing, implementing, and monitoring and evaluating so they can optimally support the achievement of the organization. Quality human resources will have a positive impact on organizational change. The demand for it is an absolute thing that will happen. In the future, organizations will demand more effective, efficient and productive management. Every activity carried out by a person is driven by something within that person. This driving force is called motivation. Motivation itself is a condition where employees have the will or need to achieve certain goals. Work motivation is the result of a collection of internal and external forces that cause workers to choose appropriate actions and encourage certain behaviors. Ideally, this behavior will be directed towards achieving organizational goals (Wibowo, 2016; Newstrom, 2011). This motivation will provide the employee with the motivation to work hard or direct them to workrelated activities, and it will make them aware of the connection between their personal and corporate goals. While someone is driven, he will work hard to achieve his goals. However, if the effort is not directed in the designed direction, it is unlikely that the hard work would result in the anticipated productivity (Mahesa, 2010). One of the determining factors in increasing employee motivation is the work experience employees in completing the specified assignments. The longer the employee’s working period, the more experience he gets. Each person has a greater motivation to improve their work performance if they have a lot of work experience. Longer working tenure has a positive impact on income levels. In this case to get welfare, one of which is compensation. The definition of compensation is “adequate and appropriate remuneration to employees for what they contribute to the organization. Compensation is one of the motivations for employees that influences motivation. Employee productivity and performance will certainly improve when good remuneration is achieved. Compensation is intended to motivate people to work as efficiently as possible to achieve the best results. Given that one of the primary reasons people works is to support their families, compensation has a significant impact on employee motivation. An employee will try to achieve maximum performance in order to receive appropriate compensation. In the annual performance report for 2022, PT Timah Tbk disclosed a total of 4,249 permanent employees as of December 31, 2022. As the leading tin-producing company in Indonesia, PT Timah Tbk significantly contributes to the economy of the Bangka Belitung Islands Province. However, the company faces challenges related to export and import regulations. Despite adhering to regulatory compensation standards in Indonesia and even surpassing them, there exists an imbalance with the productivity performance of PT Timah Tbk. This study aims to investigate the impact of compensation and employment duration on employee motivation within the HR Division of PT Timah Tbk in Bangka Belitung Island. Based on the problems above, the challenges in this research are stated as follows, based on the issues mentioned previously: 1. Analysis the impact of compensation on employee motivation. 2. Analysis the impact of work period on employee motivation. 3. Analysis how employee motivation is affected by the compensation and work period. The overall goal of this research is to find out how employee motivation in HR Division PT TIMAH Tbk is impacted by compensation and work periods. Research on the impact of compensation and work periods on employee motivation specifically serves the following purposes: 1. Identification of the factors that influence employee motivation. 2. Data analysis to determine the impact of compensation and work period elements on employee motivation.
LITERATURE STUDY Compensation Bangun (2012) employees receive compensation in exchange for the services they do on the job. Meanwhile, Sutrisno (2013) Everything an employee receives as a payment for their labor is referred to as compensation. It is different from the opinion of Hasibuan (2016) which states that all income received by employees form of the cash, tangible commodities, or intangible services in exchange for the company is referred to as for their services. Kasmir (2016) Compensation refers to the financial and non-financial recompense given by the corporation to its employees. Meanwhile, according to Zainal et al. (2014), as a replacement for their contributions to the company, compensation is something that employees receive. Compensation according to Melayu S.P. Hasibuan (2002) is all money, indirect or direct goods, and services received by employees as compensation for work completed by the company. The objectives of offering compensation include fostering a sense of mutual trust, employment satisfaction, effective dependence, incentive, employee stability, discipline, and labor union and political influence. Compensation serves as a form of appreciation or reward for employees who have contributed to the achievement of their objectives through work-related activities. (Nawawi, 2001). Any company that wants to significantly increase employee productivity must provide compensation because it is an award provided by staff employees directly or indirectly, both financially and non-financially, for their commitment to attaining organizational goals. Salary, benefits, bonuses, and commissions are the several types of financial compensation. Meanwhile, training, responsibility and authority, performance-based rewards, and a supportive work environment are all examples of non-financial compensation. (Jurnal SDM.blogspot, 2009). The indicators used to measure employee compensation according to Simamora (2006) are as follows: 1. Wages and salaries: salary / wages are compensation given weekly, biweekly or monthly. The salary / wages is in the shape of basic salary, salary performance-based, living expenses.
2. Incentives: the main component of compensation that aims to encourage increased employee productivity. This incentive consists of bonuses, commissions and a ripening curve. 3. Allowances 4. Facilities The above indicators can be used as a reference by companies in providing proper compensation for their employees. Employees will be satisfied working for the company and helping it achieve its goals if they get adequate compensation. The three primary components of compensation are direct monetary payments in the form of commissions, bonuses, incentives, and wages. Indirect payments for holidays, benefits, and other benefits make up the second type. The third type, however, consists of non-monetary benefits like paid time off, flexible work schedules, and decent office. According to Halsey (As’ad, 1997), there are four conditions that must be met in determining the amount of compensation. The four requirements are: 1. Fair for employees and companies. This means that employees should not be used as an extortion tool in the pursuit of profit. 2. The wage system should have the potential to encourage employee morale. 3. In addition to the basic wage, it is necessary to provide an incentive wage as an additional reward material. 4. The wage system must be clearly understood by employees so that there will be no bad assumption about the company. Another opinion expressed by Salter, Malcom (1988:135-49) that the terms of good compensation are: 1. Meet the basic needs of employees. 2. Fulfillment of basic needs is an absolute requirement for the formation of good compensation. 3. Compensation should be considered fair. 4. Compensation must be implemented in an equitable manner according to the agreed criteria. 5. Employee-oriented as an individual. 6. Meanwhile, as outlined by Pattern in the work of Thomas (Handoko, 1985), the criteria for compensation include addressing employees’
economic needs, aligning compensation with company success, tying compensation to productivity, and ensuring a balanced and fair compensation structure. According to Tohardi in Sutrisno (2013) The following are some elements that affect compensation: productivity, payment ability, payment willingness, demand and supply for labor. Whereas Hasibuan (2016) that these factors are as follows: Labor Supply and Demand 1. 2. 3. 4. 5. 6. 7. 8. 9.
Company Capability and Willingness Labor Unions / Employee Organizations Work Productivity of Employees Government by Presidential Decree and Law The price of living Position as an Employee Education and Work Experience State of the National Economy Work Type and Nature
Work Period
The work period is a long-life service. A person who works in an institution which is also influenced by elements of experience and the learning poses as himself, himself with his environment, institutional management and leadership experience while working. According to Oktaviani (2009) seniority or tenure is the quantity of time that an employee spends in a particular company. The point to which employees can produce results that are satisfactory at work depends on their capability, skill, and ability to complete their work effectively. The duration of an employee’s employment with a corporation or government organization is referred to as the work period. According to Siagian (2015:60): states, “Working period is the overall lesson that a person learns through the experiences that you or it through life”. Rudiansyah (2014: 44), The working period during which an employee devotes his attention to a specific organization is known as tenure, and it has an impact on many human activities. The company will benefit from a higher level of performance or production the more experienced an individual is. A working period is a time frame or the duration of time that a workforce is present in a location (Tawaka, 2017), which is categorized into 2, namely: 1. The next working period is < 5 years 2. The life service is > 5 years. Motivation Motivation etymologically comes from Latin namely “movere” (which means to move) is where the word “motivation” originates. In simple terms, motivation can be interpreted as an urge / desire to perform a certain action. Mangkunegara (2013: 94) argues that: Work motivation is described as a state that affects behavior connected to the workplace in terms of activating, directing, and maintaining it. Extrinsic motivation and intrinsic motivation, both of which have an impact on behavior and work performance, can come from within the individual (intrinsic motivation) or from outside the individual (extrinsic motivation). From a few of the definitions given above, it can be inferred that work motivation is the need that an individual has to take action and carry out a task in order to fulfill particular objectives. Another force that might inspire someone to accomplish their goals is motivation, which can come from both within and without (Rozzaid et al., 2015). According to Hasibuan (2016), a person needs to be motivated in order to be passionate about their profession and want to collaborate, perform well, and put forth all of their effort to achieve the desired fulfillment. According to Wicaksono and Hermani (2017), two aspects, namely internal and external, have an impact on motivation. The work environment, leaders and leadership, organizational or task development requirements, support or direction from superiors, and compensation are examples of external influences. Internal factors, namely: innate individual, level of education, past experience, future goals or expectations. (Wicaksono & Hermani, 2017). Newstrom in Wibowo (2015) Following are some indications of motivation: 1. 2. 3. 4.
Engagement Commitment Satisfaction Turnover
According to Mangkunegara (2017), the following are signs of Newstrom in Wibowo (2015) Following are some indications of motivation: motivation: 1.
Engagement
1. Work ethic 2. Commitment 2. Future-oriented 3. Satisfaction 3. A high degree of aspiration 4. Turnover 4. Task focus and level of importance 5. Effort to progress According to Mangkunegara (2017), the following are signs of motivation: 6. Work persistence 7. Relationship with colleagues 1. Work ethic 8. Utilization of time.
2. Future-oriented 3. A high degree of aspiration In 4.terms of measuring work motivation, it can be concluded that the Task focus and level of importance ability to guide, manage, and persuade someone to engage in the 5. Effort to progress desired behavior in order to accomplish particular goals is known as 6. Work persistence work motivation. Regarding motivation, it is one of the factors that 7. Relationship with colleagues inspires or motivates someone to be able to make something happen 8. Utilization of time.
in order to achieve goals as well as individuals. This motivation can be in In theterms formofofmeasuring values and attitudes that influence the way one work motivation, it can be concluded that thinks, the ability to guide, man acts and behaves carrying outdesired one’s behavior duties and responsibilities. persuade someone in to engage in the in order to accomplish particular goals i The person’s motivation levelmotivation, starts fromit is theone level offactors one’s that personal as work motivation. Regarding of the inspires or motivates som self-needs and this encourages the individual to carry out a certain be able to make something happen in order to achieve goals as well as individuals. This motiva activity soform thatofhevalues can and fulfill his needs in the the hope be in the attitudes that influence way of oneobtaining thinks, acts and behaves in satisfaction fromand these needs. Effective motivation needs to starts be given out one's duties responsibilities. The person's motivation level from the level of one's to self-needs employees. So that employees don’t always complain about and this encourages the individual to carry out a certain trivial activity so that he can f things, every rule given byfrom the company and also don’t needs don’t in the violate hope of obtaining satisfaction these needs. Effective motivation needs to be blame each other. Therefore, it is necessary to provide motivation employees. So that employees don't always complain about trivial things, don't violate every ru bybyincreasing employee moraleit in to to provide motiv the company and alsohard don't work blameand eachemployee other. Therefore, is order necessary achieve company goals. increasing employee hard work and employee morale in order to achieve company goals. Conceptual ConceptualModel Model Compensation (X1)
Work Period (X2)
Hypothesis
Motivation (Y)
Hypothesis The hypothesis in this research is as follows: 1. Compensation is positively impacted to employee motivation
2Work period affect to employee motivation
3. Compensation and work period affect to employee motivation
RESEARCH METHOD
This research employs a quantitative methodology with the aim of describing a problem or situation based on description of the relationship between the independent and dependent variables and determining the level of relationship between these variables. Compensation and work period are the independent variables in this study, while the dependent variable is the motivation of HR Division PT TIMAH Tbk employees. Population in quantitative research is a term that is very commonly used. Population is defined as the number of units whose characteristics will be examined. Population according to Arikunto (2002: 108), “Population is the total number of elements that are the object of research or work units in a particular area or area that are used as objects of research to obtain data sources.” Participants in this study were all employed people in HR Division PT TIMAH Tbk. In this research, researchers used a sampling technique with a purpose sampling technique. According to Sugiyono (2018: 138) determines the number of samples to be analyzed by sampling while taking specific factors into account in accordance with the required criteria. The purpose of sampling methodology is a sampling method that is based on the researcher’s evaluations of which samples are most suitable, beneficial, and seen as representative of a community. Each variable has the following operational definition: Variable concept Compensation
Indicator 1. Salary 2. Incentive 3. Allowance 4. Facilities
Scale Interval
(continued)
Variable concept Work Period Motivation
Indicator
Scale
1. The next working period < 5 year 2. The life service > 5 year 1. Need for achievement 2. Need for affiliation 3. Need for competency 4. Need for power
RESULT Test of Data Quality a) Validity Test Validity tests are used to evaluate a questionnaire’s reliability. When the survey’s questions are able to yield the data that the questionnaire is measuring, the survey is said to be valid (Ghozali, 2018). The authenticity of the distributed survey is verified using a validity test. The constructs or variables’ validity is evaluated using the correlation between the scores from the questions and the summative scores of the constructs or variables. The validation requirements are as follows: 1. The questionnaire is valid if r count> r table. 2. The questionnaire is invalid if r count <r table. 3. The column displays the determined r value of the corrected item total correlation. The following table can be used to determine if the survey data is reliable or not:
| Variable | Item | R count | R Table | Probability | Ket |
|---|---|---|---|---|---|
| Compensation (C) | C.1 | 0.624 | 0.273 | 0 | Valid |
| C.2 | 0.468 | 0.273 | 0 | Valid | |
| C.3 | 0.706 | 0.273 | 0 | Valid | |
| C.4 | 0.601 | 0.273 | 0 | Valid | |
| C.5 | 0.679 | 0.273 | 0 | Valid | |
| C.6 | 0.491 | 0.273 | 0 | Valid | |
| C.7 | 0.667 | 0.273 | 0 | Valid | |
| C.8 | 0.37 | 0.273 | 0 | Valid | |
| C.9 | 0.476 | 0.273 | 0 | Valid | |
| C.10 | 0.984 | 0.273 | 0 | Valid | |
| Work Period (WP) | WP.1 | 0.569 | 0.273 | 0 | Valid |
| WP.2 | 0.677 | 0.273 | 0 | Valid | |
| WP.3 | 0.675 | 0.273 | 0 | Valid | |
| WP.4 | 0.724 | 0.273 | 0 | Valid | |
| WP.5 | 0.579 | 0.273 | 0 | Valid | |
| WP.6 | 0.451 | 0.273 | 0 | Valid | |
| Motivation (M) | M.1 | 0.588 | 0.273 | 0 | Valid |
| M.2 | 0.688 | 0.273 | 0 | Valid | |
| M.3 | 0.582 | 0.273 | 0 | Valid | |
| M.4 | 0.512 | 0.273 | 0 | Valid | |
| M.5 | 0.436 | 0.273 | 0 | Valid | |
| M.6 | 0.697 | 0.273 | 0 | Valid | |
| M.7 | 0.664 | 0.273 | 0 | Valid | |
| M.8 | 0.647 | 0.273 | 0 | Valid | |
| M.9 | 0.531 | 0.273 | 0 | Valid |
According to Table 1 compensation and work period variable to employee motivation memiliki nilai uji validitas yang ketat. The statement is valid if the value of r count is greater than r table, which is 50 (DF= N-2 = 52-2). The data for all variable items is accurate because r count > r table with a probability value under 0.05. b) Reliability Test The reliability test is a test designed to determine whether or not the results of the research questionnaires can be believed or not. The questionnaire reliability of the results from re-testing the questionnaire were the same. The reliability test verifies that the measuring device is constant even after repeated measurements are taken in order to assess the consistency of the measuring tool. According to Ghozali (2018) the instrument will be reliable if there are similarities in data on the different times. Here are the results of the reliability test:
| Variable | Reliability Test Item Cronbach’s Alpha | KET | ||
|---|---|---|---|---|
| Compensation | 0.751 | 5 | 0.61 | Reliable |
| Work Period | 0.612 | 3 | 0.61 | Reliable |
| Motivation | 0.764 | 6 | 0.61 | Reliable |
Based on Table 2, value of reliability test greater than limit value Cronbach’s alpha (0,751>0,61), value of work period variable greater than limit value Cronbach’s alpha (0,612>0,61), and variable motivation greater than limit value Cronbach’s alpha (0,764>0,61). This indicates that all indications of compensation, work period, and employee motivation have been considered reliable and practicable to use. Classic Assumption Test Before beginning data analysis, the following needs must be satisfied: test the assumptions using the normality, multicollinearity, and heteroscedasticity tests. a) Normality Test
The figure itself is in the PDF version.
Normality Test Graphic
Normality Test Graphic
154The results of the histogram graph, the diagonal line follows the residual which is each of the i variable compensation, work period, and employee motivation. The meaning of the line is u and is not far away from the diagonal line which is parallel to the indicator residual. Finally, the
The results of the histogram graph, the diagonal line follows the residual which is each of the indicator variable compensation, work period, and employee motivation. The meaning of the line is unbroken and is not far away from the diagonal line which is parallel to the indicator residual. Finally, the research data for the variables of compensation, work period and motivation of employees are normally distributed. Besides using histogram graph, the normal P-P plot graph based on an image, shows that the dots spread around the diagonal line. The data to used has fulfilled classic assumption and can be said normally distributed. b) Multicollinearity Test
| Coefficients | |||||
|---|---|---|---|---|---|
| Model | Unstandardized Coefficients | Standardized Coefficients | Collinearity Statistics | ||
| B | Std. Error | Beta | Tolerance | VIF | |
| (Constant) | 9.077 | 3.923 | |||
| Compensation | .192 | .097 | .220 | .739 | 1.353 |
| Work Period | .845 | .154 | .607 | .739 | 1.353 |
| a. Dependent Variable: Motivation | |||||
Based on Table 3, the value of tolerance and VIF for the compensation and work period variable from the data above, where it is known that the tolerance value is 0.739 dan the VIF value is 1.353. All tolerance values are higher than 0.10, and all VIF values are below 10. This implies that there is no association between the independent variables in the regression model. Therefore, it can be interpreted that the independent variables in this study did not experience multicollinearity.
that the independent variables in this study did not experience multicollinearity.
Heteroscedasticity Test c) Heteroscedasticity Test
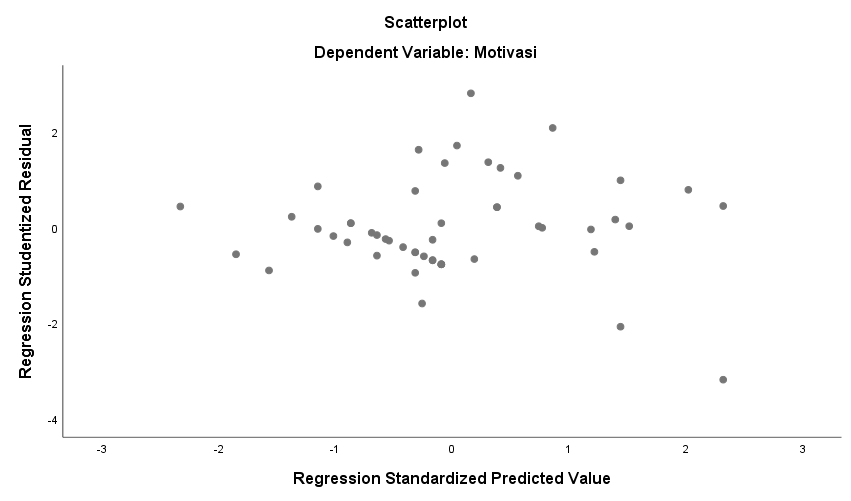
Heteroscedasticity Test
Heteroscedasticity Test
Based on Figure 2, the scatterplot graph above demonstrates that the on clearly
Multiple regression equations are used in the data analysis method Multiple regression equations are used in the data analysis method used in this research. Gh used in this research. Ghozali (2018) based to this definition regression basedistoessentially this definition regression analysis is essentially a study of how one or more analysis a study of how one or more independent variables variables (explanatory or independent to a dependent (explanatory or independent variables)variables) relate to arelate dependent variablevariable in order to population mean or mean of the dependent variable based on the known values of the in order to estimate the population mean or mean of the dependent variables. The of regression for each independent variable variable based onresult the known valuesanalysis of the independent variables. The is in the form of result of regression analysis for each independent variable is in the form of a 5coefficient. Table Multiple Linear Regression Analysis
Model (Constant) Compensation
Coefficientsa Unstandardized Standardized Coefficients Coefficients B Std. Error Beta 9.077 3.923 .192 .094 .221
Sig. .025 .047
| Coefficientsa | |||||
|---|---|---|---|---|---|
| Unstandardized Standardized | |||||
| Coefficients | Coefficients | t | Sig. | ||
| Std. | |||||
| Model | B | Error | Beta | ||
| (Constant) | 9.077 | 3.923 | 2.314 | .025 | |
| Compensation | .192 | .094 | .221 | 2.039 | .047 |
| Work Period | .845 a. Dependent Variable: Motivation | .154 | .607 Based on the results above, the equation-regression form in this research is: | 5.469 | .000 |
| M=a+b1C+b2WP+e | |||||
| M=9.077+0.192 C+0.845 WP | |||||
| M | : Motivation | ||||
| C | : Compensation | ||||
| WP | : Work Period | ||||
| a | : Constanta | ||||
| b1, b2 | : Coefficients Regression | ||||
| e : Error | |||||
Based on the results above, the equation-regression form in this research is:
M=a+b1C+b2WP+e M=9.077+0.192 C+0.845 WP M
: Motivation
: Compensation
WP
: Work Period
: Constanta
: Coefficients Regression
: Error
This justification allows for the following implementation:
1. The meaning of value content M 9.077 if compensation and work period variables are zero, so employee motivation. The constant value of M is 9,077, which means that if the pay variable, work period, is zero, then employee motivation will continue at 9,077, or 90.7 percent. 2. The coefficient regression value on the compensation variable is 0.192. It means if compensation has grown 1 time, so compensation will be change by 0.192 or 19,2 percent. Compensation will increase employee motivation if the coefficient is positive. 3. The regression coefficient on the work period variable is 0.845, which means that if the work period increases by 1 time, the employee’s motivation will vary by 0.845, or 84.5 percent. Employee motivation will increase during the work period if the coefficient is positive. Hypothesis Test a) Coefficient of Determination Test
| Coefficientsa | |||||
|---|---|---|---|---|---|
| Model | Unstandardized Coefficients | Standardized Coefficients | t | Sig. | |
| B | Std. Error | Beta | |||
| (Constant) | 9.077 | 3.923 | 2.314 | .025 | |
| Compensation | .192 | .094 | .221 | 2.039 | .047 |
| Work Period | .845 | .154 | .607 | 5.469 | .000 |
| a. Dependent Variable: Motivation | |||||
The results coefficient of determination the correlation between the independent variables and the dependent variable of R is 0.554. This indicates that the factors of compensation and work period have a rather tight relationship with employee motivation. The relationship happen is positive and connected with a high degree of relationship, from the data analysis. Adjusted R Square is 0.535. This indicates that the variance of the compensation and work period variables can account for 53.5% of the variance of the employee motivation variable. While other variables outside the scope of this research have had an impact on the remaining 46.5 percent. b) F Test
| Model Summaryb | |||||
|---|---|---|---|---|---|
| Model | R | R Square | Adjusted R Square | Std. Error of the Estimate | Durbin-Watson |
| 1 | .744a | .554 | .535 | 2.361 | 2.199 |
| a. Predictors: (Constant), Work Period, Compensation | |||||
| b. Dependent Variable: Motivasi | |||||
Based on Table 6, a test with a significance level of α = 0.05 retrieved from A-Table 3.18 provides information on the f test. The result of the statistics significance test F-count is 30.384 with a significance of 0.000. The significance level was less than 0.05, according to the significance value. Therefore, F-count> F-Table (30.384>3,18) shows that the compensation variable, work period, has a positive effect on employee motivation. c) Partial Effect Significance Test (T Test)
| ANOVAa | ||||||
|---|---|---|---|---|---|---|
| Model | Sum of Squares | df | Mean Square | F | Sig. | |
| Regression | 338.770 | 2 | 169.385 | 30.385 | .000b | |
| Residual | 273.153 | 49 | 5.575 | |||
| Total | 611.923 | 51 | ||||
| a. Dependent Variable: Motivation | ||||||
| b. Predictors: (Constant), Work Period, Compensation | ||||||
The following can be concluded from the hypothesis testing findings based on Table 7: •
First Alternative Hypothesis Testing
The results of the test of the regression coefficient of the compensation variable on employee motivation were 2.039 for the t-count and 0.047 for significance. The significant value of the t-count test is lower than α = 0.05 and the statistical value is higher than t-Table (2.039> 1.676). Therefore, it can be inferred that the compensation variable has a positive and significant impact on employee motivation factors because this test demonstrates that H0 is rejected and Ha is accepted. • Second Alternative Hypothesis Testing The results of the regression coefficient of the work period variable on employee motivation, based on from t-count value for the work period is 5.469 and the significant value is 0.000. The statistical test value was higher than t-Table (5.469>1.676) and less than α = 0.05 significance value. The testing can show has that H0 is rejected and Ha is accepted, so the work period variable is significantly impacted by the motivation factors. CONCLUSION AND RECOMMENDATION The result of this research at HR Division of PT TIMAH Tbk, which included sending out questionnaires to 52 respondents and having descriptions is 53.5 percent of the variance in employee motivation can be accounted for by the variation in the variables of compensation and work period. While additional factors that were not considered in this research had an impact on the remaining 46.5 percent. It is possible to conclude that compensation influences employee motivation positively. This implies that employees, the higher their compensation, the higher their motivated. Likewise, the less compensation employees get paid, the less motivated they will be to work. Similar to compensation, work period to affects positive to employee motivation. The longer an individual has been employed, the more motivated they are. When dealing with workers who lack motivation at work due to internal or external factors that the workers themselves have created. For example, a workplace that is perceived as being less supportive, so the company has to give rewards to motivate workers. Or provide employees with extra incentives for exceeding corporate expectations, which can increase their drive and passion for success. Giving employees flexibility is an additional example of how to help them become more knowledgeable in their fields of competence. The compensation at PT TIMAH Tbk company complies with all legal requirements and is even higher than the regional UMR. Receiving compensation as an employee might boost their motivation and productivity while performing activities. Although the results are favorable in terms of the length of service or their work period, there are a number of significant aspects that the length of service of employees can be taken into account for future compensation and career paths. Calculation of work periods in providing compensation and career paths is a form of Company appreciation for employees, so it is expected to increase employee motivation. The research outcomes are anticipated to offer insights into the present state of the company, serving as a basis for discussions and considerations in shaping future company policies to mitigate potential future risks. Furthermore, for the advancement of scientific knowledge, it is hoped that this research will open avenues for other researchers to utilize it in diverse studies, incorporating different subjects and additional variables to yield more intricate results.
ACKNOWLEDGMENT
First of all, the author said Thank God to Allah SWT. who has given mercy and blessing so that the author can finish this article well. The author realizes that in tthe process of writing this article encountered many obtacles. But with the help, guidance and cooperation from various parties, the obtacles faced can be overcome. So that the authors would like to express her thanks to: 1. Universitas Bangka Belitung for providing knowledge and for carrying out this research. 2. PT TIMAH Tbk provide the opportunity to collect research data. 3. And Universiti Utara Malaysia has held an international conference.
References
- Arviadi T. H., Murgianto., & TriA. (2022). The effect of transformational leadership, compensation and self efficacy based on job satisfaction and performance of lecturers at Faculty of Veterinary Medicine, Airlangga Universitas. International Journal of Economics, Business and Management Research, 6(1), 129-141.
- As’ad, Moh. (1997). Psikologi Industri. Liberty. Yogyakarta; 2000.
- Chaudary, N., & Sharma, D. B. (2018). Impact of employee motivation on work performance. International Journal of Scientific and Research Publications (IJSRP), 8(3), 29-35. https://doi.org/10.29322/ijsrp.8.3.2018.p7544.
- Dhitanayu C., Bayu A. P., & Mochamad A. (2020). Effect of career, employee enggagement, and compensation of behavior organisational citizenship in PT. Wika Intinusa Surabaya, Quantitative Economics and Management Studies, 1(2), 117-129.
- Dessler, G. Human Resources Management, Eight Edition, Prentice-Hall, Inc.
- Fredy, J., Abdul Kadir, Endah S., B., Maysusan E. T., & Naimah. (2023). The influence of organizational citizenship behavior and organizational commitment on employee performance at the regional revenue management agency North Barito Regency, Central Kalimantan Province, International Journal of Economics, Business and Management Research, 7(6), 29-43.
- Ghazanfar, F., Chuanmin, S., Khan, M. M., & Bashir, M. (2011). A study of relation between satisfaction with compensation and work motivation. International Journal of Business and Social Science, 2(1), 120-131.
- Handoko, T. H. (1985). Manajemen Personalia Dan Sumberdaya Manusia. Penerbit Liberty.
- Hasibuan, M. S. (2016). Manajemen Sumber Daya Manusia. Jakarta: PT Bumi Aksara.
- Juliandi, A., Irfan., & Manurung, S. (2015). Metodologi Penelitian Bisnis Konsep dan Aplikasi. Medan: UMSU PRESS.
- Kasmir. (2016). Manajemen Sumber Daya Manusia. Jakarta: PT Raja Grafindo Persada.
- Kaswan. (2017). Psikologi Industri & Organisasi. Bandung: Alfabeta.
- Khair, H. (2017). Manajemen Kompensasi. Medan: Madenatera.
- Laminingrum, A. K. (2016). Pengaruh Kompensasi terhadap Motivasi Kerja pada Karyawan Biro Pelayanan Sosial Dasar di Sekretariat Daerah Provinsi Jawa Barat. e-Proceeding of Management, 3(2), 1871-1879.
- Mangkunegara, Anwar Prabu. (2013). Manajemen Sumber Daya Manusia dan Perusahaan. Bandung: Remaja Rosdakarya Bandung.
- Muhammad, A. (2018). Pengaruh kompensasi terhadap motivasi kerja di PT Hametetsu Indonesia. Jurnal Ilmu Administrasi, 3(1), 426-433.
- Pattern, T. (2001). Dalam Pengaruh Etos Kerja Dan Kompensasi Terhadap Kinerja. Meliana Ambarwati. Universitas Krisnadwipayana. Jakarta.
- Reniati, R., Surya, N., & Diki, D. (2021) Pengaruuh penilaian kinerja, kompensasi dan kepuasan kerja terhadap kinerja pegawai (studi kasus pada Direktorat Jendral Pajak Area Kota Pangkalpinang), Jurnal Ilmiah Ekonomi Bisnis, 26(2), 167-182
- Salter, M., & Weinhold, WA. (1988). Corporate takeovers: Financial boom or organizational bust. Knights, Raiders, and Targets, 135-149.
- Simamora, H. (2006). Manajemen Sumber Daya Manusia. Yogyakarta: STIE YKPN.
- Sutrisno, E. (2013). Manajemen Sumber Daya Manusia. Jakarta: Kencana Prenada Media Group.
- Suwanto Suwanto. (2020). The effect of discipline and motivation on employee performance in SMP Negeri 2 Parigi, Pangandaran District. Jurnal Studi Guru dan Pembelajaran, 3(3), 534-544.
- Tamam, A. A. P. F., Wulandari, D., & Titisari, P. (2020). The role of motivation as the mediating influence of organizational commitment and compensation toward job performance of honorary employee category II at transformation office of Pamekasan. International Journal of All Research Writing 3(2), 46-53.
- Tono, W., Bambang. S. (2020). The assessment of leadership style, competence, motivation, and compensation to employee performance. Indonesian Journal of Social Research (IJSR), 2(1), 76-87.
- Wibowo. (2015). Perilaku dalam Organisasi. Jakarta: PT Raja Grafindo Persada.
- Wicaksono, W. D., & Hermani, A. (2017). Pengaruh kepemimpinan dan kompensasi terhadap motivasi kerja karyawan public departement biro perjalananan tour & travel. Jurnal Administrasi Bisnis, 6(3), 1-10.