The Determinants of Intention to use E-voting System: The Case of Generation X in Malaysia
- Faculty of Business and Finance, Universiti Tunku Abdul Rahman, Kampar, Perak
Journal of Business Management and Accounting 10(1) (2020) · https://doi.org/10.32890/jbma2020.10.1.3
Abstract
The internet has opened doors for electronic voting (E-voting). A review of the loopholes of the 14th General Election in Malaysia including the delay of votes from overseas voters, the declaration of a public holiday on voting day and the extraordinary heavy traffic, implies that E-voting could be a better alternative to the paper-based ballot voting. Therefore, the objective of this study is to examine the determinants of the intention to use the E-voting system among Generation X in Malaysia. This study focused only on Generation X because most internet users are from this age group (22 to 37-year olds) compared to other age groups. Hence, Generation X may be the focus of E-voting. A survey of 351 respondents on their intention to use E-voting system was conducted throughout 13 states and the Federal Territory of Kuala Lumpur (Wilayah Persekutuan). Additionally, an empirical model was drawn from adopted theories and data was analyzed using the Partial Least Squares – Structural Equation Modeling (PLS-SEM) approach. The findings showed that compatibility, relative advantages and perceived ease of use significantly contributed to the intention to participate in E-voting. However, perceptions of image, complexity of use, perceived usefulness, trust in the internet and in the government are not significantly related to the intention to use E-voting.
Keywords: E-voting, government, PLS-SEM
1.0Introduction
Many governments, especially in countries that practice democracy, believe that the emergence of electronic voting (E-voting) can help to further boost the democratic process (Alomari, 2016). Hence, countries such as the United States, Australia, India, Belgium, Brazil, Estonia, Mexico, Peru and the Philippines have launched E-voting in part, or in total, in their respective electoral systems. Furthermore, many voters,
Email: kuahyc@utar.edu.my especially the youth, prefer E-voting over paper-based ballot voting as it allows the election process to function more easily and conveniently (Christian Schaupp & Carter, 2005; Alvarez, Hall, & Trechsel, 2009; Powell, Williams, Bock, Doellman, & Allen, 2012; Zucco & Nicolau, 2016). In addition, Germann and Serdült, 2017 urged researchers to explore the relationship between E-voting and voter turnout rates. In turn, some scientific findings show E-voting helps to increase the turnout rates of voting. For instance, 90% of voter turnout in the 2006 Netherlands elections were E-voters (Elewa, AlSammak, AbdElRahman, & ElShishtawy, 2005). Nevertheless, online voters have also expressed some trust and security concerns in E-voting, such as leaks in personal details, the trustworthiness of technology and vote manipulation (Gritzalis, 2002; Christian Schaupp & Carter, 2005; Warkentin, Sharma, Gefen, Rose, & Pavlou, 2018).
Even though the most recent general election in Malaysia – the 14th General Election, achieved a 82.32% turnout rate of registered voters (Rahman, 2018), there is room for improvement in the electoral system as some loopholes were encountered. Firstly, the election was held on a weekday and it was declared a public holiday nationwide. This may have caused disruptions to the daily activities of business enterprises. From the economic perspective, a surprise public holiday could directly affect businesses’ profit margins (Zhafry & Kiesha, 2017). Secondly, there was heavy traffic and accidents on the highways as a result of the huge numbers of voters returning to their voting stations in their hometowns. Additionally, voters from overseas encountered some difficulties in returning to the country to vote due to high costs of flights and the delay in postal ballots reaching some of them (Tan & Tay, 2018). In fact, all these limitations can be overcome and improved if the E-voting system is implemented.
In view of this, Parti Keadilan Rakyat (PKR), one of the political parties that was in the former ruling coalition, had recently employed the E-voting system for electing their leaders in the 800,000-member party (Saifuddin, 2018). Singh (2015) reported that the government would save millions on the printing of ballot papers, distribution, security and logistics if the online e-voting system can replace the cumbersome traditional ballot-paper voting system. Furthermore, E-voting could more likely help to improve the turnout rate of young people to exercise their voting rights and it would also allow for quicker checks on invalid or spoilt votes and for the election results to be known much earlier (Singh, 2015).
However, the former Election Commission Chairman Tan Sri Abdul Aziz Mohd Yusof had voiced his objections on the implementation of an E-voting system, arguing that the E-voting system would be expensive due to the need to purchase large numbers of computers and related equipment, retraining electoral staff and also other logistic costs. Furthermore, according to him, the current voting system was more transparent, as every single count on each ballot was shown to the representatives of each political party (Singh, 2015). In the light of the above, E-voting has its pros and cons. Should we implement it? To what extent will Generation X accept this new method of voting in the country? What are the determinants of the intention to use the E-voting system among Generation X in Malaysia? Understanding people’s perceptions on E-voting is crucial, as voters are the ones who will determine the success or failure of the proposed E-voting system in the country. If the electorate is not willing to accept and use it, it is pointless for the Elections Commission to develop and implement the E-voting system in Malaysia.
To date, there is still a lack of survey studies regarding Malaysians’ perceptions on the use of the E-voting system in the future. In order to fill the research gap, this study investigated the determinants of the intention to use the E-voting system based on the adoption theories which comprise of Technology Acceptance Model (TAM), Diffusion of Innovation (DOI) and Web Trust. The survey was carried out throughout the country in all 13 states and the Federal Territory of Kuala Lumpur. The survey data was then analyzed using the Partial Least Squares – Structural Equation Modeling (PLS-SEM) approach. The findings can be a reference for the Elections Commission, E-voting system developers and the government on the implementation of an E-voting system in Malaysia in the future.
2.0Literature Review
This section provides a review of the literature on the adoption of technology and how they relate to the implementation of E-voting. The approaches utilized in this study consisted of Diffusion of Innovation (DOI) by Rogers (1995), Technology Acceptance Model (TAM) by Davis (1989) and Web Trust by Carter and Belanger (2005). The decision of individuals to use the electronic service delivery method over other conventional methods can be considered as a technology adoption issue. Thus, this research study can be viewed as employing existing theories in a technological context to a more specific area: technology adoption in E-voting.
2.1Generation X in the Adoption of E-Voting
In this study, Generation X refers to the group of individuals who were born during the years between 1981 – 1996. The uniqueness of this group is that, they were the first generation to have the advantage of exploring the world of information and communication technology (ICT) in the form of computers and other communication devices. They have greater preferences for virtual communication in their daily activities, be it social, study, work or pleasure. According to Martin, Steward and Hillison (2001), Generation X prefer to use computers or smart gadgets in their daily routines. This can explain how the E-voting system can be more relevant, useful and meaningful to them. Even though the E-voting system is yet to be implemented in Malaysia, with this study, researchers will be able to understand the intention to use it.
2.2Diffusion of Innovation (DOI)
The Diffusion of Innovation Theory attempts to explain how, why and at what rate new ideas and technologies spread through the society. It also provides an understanding on how innovation becomes widespread over time within and across societies. In this theory, Rogers (1995) defined diffusion as the process by which an innovation is communicated via certain channels over time among the societies, as well as how the members of the society have accepted and adopted it. There are four key essential components that influence diffusion, which include the innovation itself and how it is communicated, the innovation timing and the nature of the social system into which the innovation is being introduced. Rogers (1995) proposed that this diffusion process occurs over time. As the potential adopters are aware of the innovation, they will be convinced of the its values and come to a decision on its adoption and implementation. Lastly, they will evaluate the results.
Furthermore, Rogers (1995) suggests that an individual’s decision on whether to use technology is based on perceptions of the technology in terms of image, relative advantage, compatibility and complexity. In this study, researchers are interested in the factors that affect adoption of IT as well as other aspects within the field of information technology. As new technologies are developed and implemented, the application of the diffusion theory can provide systematic models that help to predict the adoption and diffusion of these technologies.
Rogers (1995) also defined compatibility as the degree by which an innovation is perceived to be consistent with existing values, past experiences and the needs of potential adopters. It suggests that if technology is compatible with the present circumstances, the potential adopters will become less uncertain and become encouraged and positive towards adopting the innovation or idea. Compatibility of E-voting can be affected by the degree of openness of the platforms (Adeshnina & Ojo, 2014; Alomari, 2014; 2016). If the government established different voting platforms compared to the traditional voting system, it may not be easy for voters to use.
Thus, the following hypothesis was formulated based on the review of the past studies:
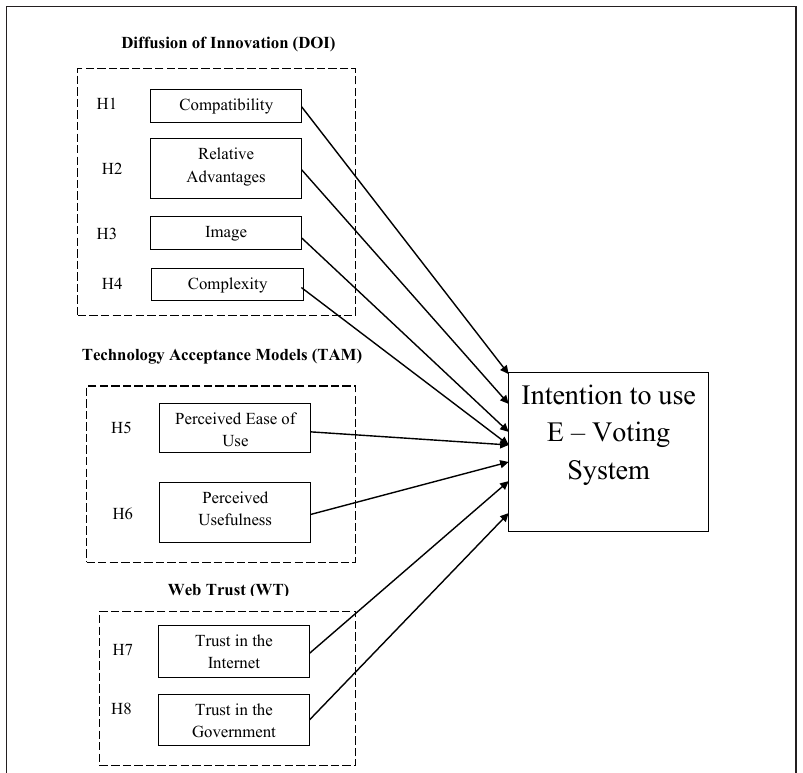
H1: There is a significant positive relationship between compatibility of an E-voting system with the intention to use it.
According to Rogers (1995), relative advantage is defined as the degree to which an innovation is seen as better than its predecessor. In the perspective of E-voting, this relative advantage can be defined as the degree to which an online voting system is perceived as being better than other traditional methods of voting. One aspect of relative advantage consists of the convenience with respect to time and location of being casting votes online (Alomari, Woods, & Sahdhu, 2012; Abu-Shanab, 2014; Rana, Dwivedi, & William, 2015). Citizens who recognize and appreciate these relative advantages are more likely to adopt any of these E-voting systems (Rana, et al, 2015). Hence, the following hypothesis was proposed:
H2: There is a significant positive relationship between the relative advantages of an E-voting system with the intention to use it.
Schaupp and Carter (2005) defined perceptions of image as whether potential users view themselves as more successful, up-to-date and modern, or intellectual due to adoption of new technologies. Those participating in E-voting systems can perceive themselves as being more popular with their peers, or having a higher level of respect or status as a result of their participation in this new application of technology. Thus, it proposed the following hypothesis:
H3: There is a significant positive relationship between perceptions of image with the intention to use an E-voting system.
Complexity is defined as a person’s belief of the effortlessness involved in using a system to perform a task (Davis, 1989). With respect to E-voting, this includes the characteristics of the usability of online systems, such as the ability to comprehend the website, to interact with it, and to navigate it in order to accomplish the related goals of obtaining relevant voter information and casting their votes online. For instance, if an online system is difficult to access or use, or if the design makes it challenging for users to find the desired information or to navigate the site, it will not be used as desired. Hence, governments that intend to design E-voting systems, need to ensure that the system is properly designed, easy to understand and navigate, and is user-friendly for users to complete their voting transactions. Thus, the following hypothesis is proposed:
H4: There is a significant negative relationship between the complexities of use with the intention to use an E-voting system.
2.3Technology Acceptance Models (TAM)
The Technology Acceptance Model is an extension of the theory of reasoned action (TRA) to technology. It describes the individual’s evaluation of a model’s potential to perform a specific task. The model attempts to predict how an individual accepts and adopts the use of new technology (e.g. Internet). It proposed that beliefs have an impact on attitudes towards new systems such as those used for E-voting. These beliefs can lead to intentions and behaviors related to actual technology usage. The beliefs that predict the use of technological systems include perceptions about the usefulness of the technology related to improved performance and perceptions about the ease of use of the technology (Davis, 1989).
Perceived ease of use is defined as the degree to which a person believes that using a particular system would be effortless (Davis, 1980). Abu-Shanab (2014) suggested that the perceived ease of use may be instrumental to increased adoption. Past studies (Hung, Chang, & Kuo, 2013; Powell, Williams, Bock, Doellman, & Allen, 2012) suggested that an increase in the perceived ease of use can lead to higher usage and have direct positive influences on the intention to engage in the desired behavior. Davis (1989) proposed that the individual’s perceived ease of use can influence his/her intention about the usefulness of the technology. Thus, the following hypothesis was proposed:
H5: There is a significant positive relationship between the perceived ease of use with the intention to use an E-voting system.
Perceived usefulness is the degree to which a person believes that using a system would improve performance (Davis, 1989). With respect to E-voting, it also can be defined as the perceptions of potential voters about E-voting as a way to participate in elections more efficiently, including saving time, being useful or being convenient. Thus, the following hypothesis was proposed:
H6: There is a significant positive relationship between the perceived usefulness with the intention to use an E-voting system.
2.4Web Trust (WT)
Driscoll (1978) defined trust in two dimensions: either as an assessment of the current situation or as an innate personality trait / predisposition. It is an important component of user decision making, as the level of trust can affect the intention of individuals, whether or not to carry out the behavior (Alzahrani, Al-Karaghouli, & Weerakkodv, 2017). If an individual has not established trust in E-commerce, it may cause his/her lack of trust in other areas like E-voting. The level of trust can vary depending on the person and the situation. A lack of sufficient trust can limit the use of e-government initiatives, such as E-voting systems, by citizens.
Findings in the study of Carter and Belanger (2005) suggested that a higher perception of trust in the internet by a citizen has a direct and positive effect on his/her likelihood to use E-voting systems. Fakhoury & Aubert (2015) suggested that if citizens are to use E-voting systems, they must believe that online service providers will ensure the privacy, security and reliability of an efficient E-voting process. As E-voting systems contain personal information and deal with confidential voting transactions, the adoption of these systems may face objections and opposition if system providers cannot guarantee an accurate, consistent and secure process. Hence, the following hypothesis was formulated based on the review of past studies:
H7: There is a significant positive relationship between trust in the internet with the intention to use an E-voting system
The study of Miller and Listhaug (1990) suggested that trust in the government is an assessment of whether political authorities and institutions are performing in accordance with the expectations of the public. Moreover, trust is also important in the society for both the legitimacy and stability of the political systems (Barber, 1984; Song & Lee, 2016). The study by Song and Lee (2016) further added that trust can increase the stability of democratic society and reduces the level of fear and worry among citizens. Dahl (1971) acknowledged that a democratic society is unlikely to emerge without political trust and that it makes a democracy work. Thus, trust in government encourages compliance with laws and regulations, considered an important feature of a democratic government (Fitzgerald & Wolak, 2016; Kim & Lee, 2012; Fakhoury & Aubert, 2015). Government actions and policy issues significantly influence citizens in terms of trust. Individuals are more likely to trust the government when they believe it is pursuing policies and producing outcomes that are consistent with their own preferences (Fitzgerald & Wolak, 2016; Kim & Lee, 2012). Hence, the following hypothesis was formulated based on the review of past studies:
H8: There is a significant positive relationship between trust in the government with the intention to use E-voting system
This study proposed its research framework (refer to Figure 1) based on the review of past studies. It integrates three models – Diffusion of Innovation (DOI), Technology Acceptance Model (TAM) and Web Trust (WT). Gilbert, Balestrini, and Littleboy (2004) suggested that this model integration method enables the identification of the major variables and the relationships among the variables that could influence the adoption of E-government services by citizens. One of the significant contributions of this method of model integration is reduction of the limitations of each model’s individual approaches. The proposed framework of this study showed that all factors are correlated with the intent to use an E-voting system based on past studies. This framework has extended previous studies on technology adoption models by integrating possible constructs and by considering the possible relationship between the independent variables and the respondents’ overall intentions.
3.0Theoretical Model
3.0Theoretical Model
Diffusion of Innovation (DOI)
H1 Compatibility
Relative H2 Advantages
H3 Image
H4 Complexity
Technology Acceptance Models (TAM)
Intention to use Perceived Ease of H5 Use E – Voting System Perceived H6 Usefulness
Web Trust (WT)
Trust in the H7 Internet
H8 Trust in the Government
4.0Methodology 12
This study used a quantitative survey as data collection technique. The data was collected through a field survey using self-administered questionnaire in Malaysia among the Generation X aged between 22 years to 37 years old (Born between 1981 to 1996). For the quantitative survey, the questionnaire which was available in English, basically comprised of two sections completed by respondents within a specified time frame. Section A featured the respondent’s demographic details and section B contains items to measure each of the study’s variable. Section A comprised of questions related to nationality, age, gender, marital status, religion, educational level, occupation, country of origin and income. Additionally, Section B consist of items of each variable using the 5-point Likert-type scale with “strongly agree” represented by five (5) and “strongly disagree” represented by one (1).
5.0Results
5.1Descriptive Analysis
The population of this study comprised of students and academic staff from Universiti Tunku Abdul Rahman (UTAR). There are around 5000 students and 200 staff in UTAR Faculty of Business and Finance, out of which a sample size of 351 was selected. This number is and considered sufficient based on sample size requirements in Structural Equation Modelling (SEM) as suggested by Hair et al. (1998). A convenience sampling method was used to collect the data. Data from the questionnaires was analyzed using the Statistical Package for Social Sciences (SPSS) version 20 and the SMART Partial Least Square (PLS) version 3.2. Among the total respondents, about 56.98% were female and 43.02% male. More than 80% of respondents fell in the 18-24 years old category, 8.55% in the is 25-29 years old category while only 3.13% were in the 30-39 years old category. 91.74% of them were single while 8.26% were married. Since the majority of the respondents are young with only PMR qualifications (79.77%) with no incomes (83.48%), they had no voting experience in the 14th Malaysian General Elec- tions.
| N | Percentage | |
|---|---|---|
| Gender | ||
| Female | 200 | 56.98 |
| Male | 151 | 43.02 |
| Ethnic Group | ||
| Malay | 9 | 2.57 |
| Chinese | 323 | 92.02 |
| Indian | 14 | 3.99 |
| Others | 5 N | 1.42 (continued) Percentage |
| Age | ||
| 18-24 years | 310 | 88.32 |
| 25-29 years | 30 | 8.55 |
| 30-39 years | 11 | 3.13 |
| More than 40 years | 0 | 0.00 |
| Marital Status | ||
| Single | 322 | 91.74 |
| Married | 29 | 8.26 |
| Highest Education Level | ||
| PMR | 280 | 79.77 |
| SPM | 13 | 3.70 |
| Diploma/Advanced Diploma | 2 | 0.57 |
| Bachelor Degree | 35 | 9.97 |
| Master Degree | 21 | 5.98 |
| Professional Certificate | 0 | 0.00 |
| Monthly Income | ||
| No income | 293 | 83.48 |
| Less than RM2,500 | 3 | 0.85 |
| RM2,501-RM3,500 | 20 | 5.70 |
| RM3,501-RM4,500 | 22 | 6.27 |
| More than RM4,500 | 13 | 3.70 |
| Status of Respondents | ||
| Malaysian | 347 | 98.86 |
| Non-Malaysian | 4 | 1.14 |
| Registered as Voter? | ||
| Yes | 81 | 23.08 |
| No | 270 | 76.92 |
| Voting Experience | ||
| Never | 273 | 77.78 |
| 1 time | 76 | 21.65 |
| 2 times | 2 | 0.57 |
| 3 times | 0 | 0.00 |
| 4 times | 0 | 0.00 |
| Source: Authors descriptive analysis of data | The Determinants of Intention to use E-voting System: The Case of Generation X in Malaysia: 47-64 | 57 |
6.0Findings
Next, the PLS-SEM analysis was performed in two stages. The measurement model was evaluated in the first stage while the structural model was evaluated in the second. The measurement model evaluated the relationships between the observed items and their latent variables. The measurement variable model was examined through an assessment of validity and reliability of the construct measures in the model. This ensured that only reliable and valid constructs’ measures were used to assess the nature of the relationships in the overall model.
6.1Measurement Model
6.1.1Convergent Validity
To analyze the latent constructs’ convergent validity, the standardized factor loading (>0.6), the average variance extracted (AVE> 0.5) and the composite reliability (CR>0.7) were taken into account (Hair et al., 2010). Based on Table 2, factor loading for all items exceeded the recommended value of 0.6 (Chin et al., 1997). The composite reliability values, which depicts the degree to which the construct indicators explain the latent construct exceeded the recommended value of 0.6 (Hair et at., 2010) with values ranging from 0.857 to 0.921. The average variance extracted which reflect the overall amount of variance in the indicators accounted for by the latent constructs also exceeded the recommended value of 0.5 (Hair et al., 2010) in the range of 0.667 to 0.796.
| Variable | Items | Loading Composite | Average Cronbach |
|---|---|---|---|
| Reliability | Variance | Alpha | |
| Extracted | |||
| Compatibility | CO1 0.714 0.875 0.703 0.703 CO2 0.89 CO3 0.9 | ||
| Relative Advantage | RA1 0.891 0.908 0.712 0.712 RA2 0.841 RA3 0.869 RA4 0.769 | ||
| Image | IM1 0.902 0.911 0.796 0.774 IM2 0.851 IM3 0.887 (continued) | ||
| Variable Items | Loading Composite Average Cronbach Reliability Variance Alpha Extracted | ||
| Complexity CX1 | 0.811 0.857 0.667 0.667 | ||
| CX2 | 0.842 | ||
| CX3 | 0.796 | ||
| Perceived Ease of Use PE1 | 0.917 0.921 0.796 0.796 | ||
| PE2 | 0.925 | ||
| PE3 | 0.832 | ||
| Perceived Usefulness PU1 | 0.834 0.912 0.723 0.723 | ||
| PU2 | 0.883 | ||
| PU3 | 0.885 | ||
| PU4 | 0.797 | ||
| Trust in the Internet I1 | 0.864 0.904 0.704 0.704 | ||
| I2 | 0.885 | ||
| I3 | 0.902 | ||
| I4 | 0.687 | ||
| Trust in the Government ToG1 | 0.646 0.869 0.723 0.693 | ||
| ToG2 | 0.919 | ||
| ToG3 | 0.902 | ||
| Intention to use E-voting system I1 | 0.594 0.879 0.793 0.709 | ||
| I2 | 0.776 | ||
| I3 | 0.893 | ||
| I4 | 0.778 |
6.2Discriminant Validity
Discriminant validity is the extent to which the measures do not reflect other variables and it is indicated by the low correlations between variables by examining the comparisons between average variance extracted (AVE). The formula of Fornell and Larker (1981) requires that the square root for each construct’s AVE should be higher than all its correlations with other constructs. Squared correlations for each construct were less than the square root of the average variance extracted, as shown in Table 3. It can be concluded that the constructs in this study have a good level of discriminant validity. The Determinants of Intention to use E-voting System: The Case of Generation X in Malaysia: 47-64 59
| Compatibility Complexity Ease of Image Intention E Relative Trust in the | Trust Usefulness | |||
|---|---|---|---|---|
| Use | voting | Advantages Government | in the | |
| Internet | ||||
| Compatibility 0.838 | ||||
| Complexity 0.570 | 0.817 | |||
| Ease of Use 0.502 | 0.696 0.892 | |||
| Image 0.355 | 0.285 0.267 | 0.880 | ||
| Intention E voting 0.533 | 0.374 0.403 | 0.264 | 0.842 | |
| Relative Advantages 0.711 | 0.533 0.401 | 0.460 | 0.532 0.844 | |
| Trust of Government 0.375 | 0.134 0.186 | 0.305 | 0.301 0.384 0.832 | |
| Trust of Internet 0.472 | 0.286 0.224 | 0.455 | 0.340 0.490 0.647 0.839 | |
| Usefulness 0.510 | 0.694 0.672 | 0.266 | 0.385 0.466 0.141 0.253 0.850 | |
| Source: Authors’data analysis | ||||
7.0Discussion
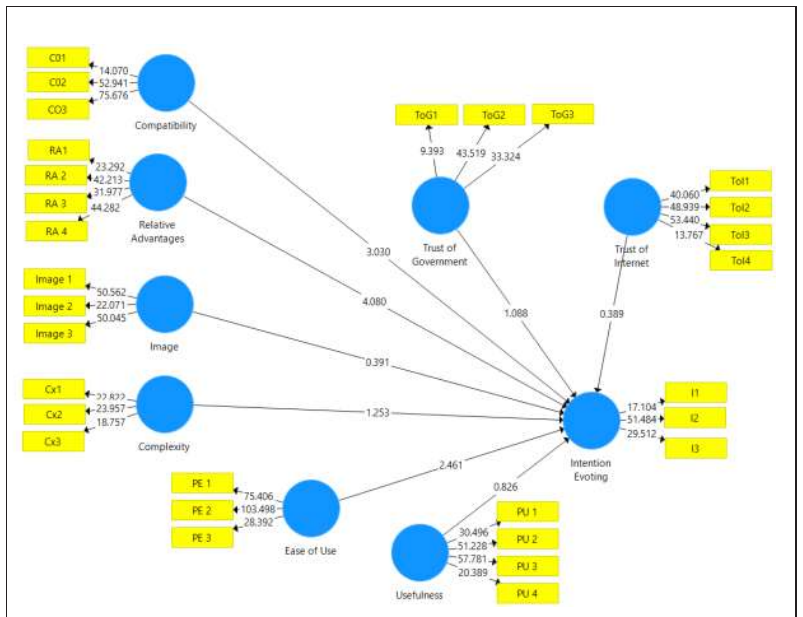
Path coefficients can be reported based on the results of PLS structural model after both the reliability and validity of the measures are determined. Table 4 shows the significance of the path coefficients based on the t-value which can be compared with critical value from the standard normal distribution to decide whether the coefficients are significantly different from zero. For instance, the critical value for significance level is 1.96 (two-tailed test). In this study, the results showed that compatibility, relative advantages, and perceived ease of use are significantly related with the intention to use the E-voting with positive significance. It appears that the online voting system is perceived as better than other traditional methods of voting. One aspect of relative advantage consists of the convenience of time and ease of use when casting votes online (Alomari, Woods & Sahdhu, 2012; Abu – Shanab, 2014; Rana, Dwivedi & William, 2015).
However, perceptions of image, complexity of use, perceived usefulness, trust of in the internet and trust in the government were not significant with intention to use E-voting. For instance, if an E-voting system is complicated or if the design makes it challenging for users, it will not be highly used. Furthermore, as E-voting systems contain personal information and deal with confidential voting transactions, the adoption of these systems may encounter objections if system providers cannot guarantee accurate, consistent and secure process. Negative perceptions of image indicate that most Generation X respondents still do not have complete trust in the Internet and the government.
| Description | Hypothesis | Path | t-value | Results |
|---|---|---|---|---|
| coefficient | ||||
| Compatibility -> Intention | H1 | 0.225 | 0.002*** | Supported |
| Relative Advantages -> Intention | H2 | 0.287 | 0.000*** | Supported |
| Perceptions of Image -> Intention | H3 | -0.022 | 0.696 | Not supported |
| Complexity of Use -> Intention | H4 | -0.091 | 0.210 | Not supported |
| Perceived Ease of Use -> Intention | H5 | 0.179 | 0.014* | Supported |
| Perceived Usefulness -> Intention | H6 | 0.069 | 0.409 | Not supported |
| Trust in the Internet -> Intention | H7 | 0.031 | 0.697 | Not supported |
| Trust in the Government -> | H8 | 0.062 | 0.277 | Not supported |
| Intention | ||||
Note: all p-values are two-tailed, * significant at 0.05, *** significant at 0.001. Source: Authors’ data analysis using Smart PLS
8.0Conclusion
The present study was designed to investigate the determinants of intention to use Evoting based on technology adoption theories, which include TAM, DOI and Web Trust.
8.0Conclusion
The present study was designed to investigate the determinants of intention to use E-voting based on technology adoption theories, which include TAM, DOI and Web Trust. This study uses the primary data approach to investigate Malaysians’ E-voting intention. The sample size of this paper was 351 respondents. The data was further analyzed through SPSS and SMART Partial Least Square for Structural Equation Modelling. Under the SMART Partial Least Square, the data was analyzed through both the measurement and the structural models. Convergent as well as discriminant validities were performed in the measurement model. The findings indicated that these constructs have a good level of validity.
A positive correlation was found between compatibility, relative advantages, and perceived ease of use towards the intention to use an E-voting system, at 5% significance level among Generation X in Malaysia. These results match those observed in earlier studies (Abu-Shanab, 2014; Adeshnina & Ojo, 2014; Alomari, Woods, & Sahdhu, 2012; Alomari, 2014; 2016, Hung, Chang, & Kuo, 2013; Powell, Williams, Bock, Doellman, & Allen, 2012; Rana, Dwivedi, & William, 2015). For instance, findings of this study showed an increase in the perceived ease of use which could lead to higher usage of E-voting system. Thus, the government should minimize technical issues, design user-friendly websites and ensure internet stability in order to increase efficiency and effectiveness of the election process. Nevertheless, the results of this investigation show that perceptions of image, complexity of use, perceived usefulness, trust in the internet and trust in the government are not significantly associated with the intention to use an E-voting system.
Sheranova (2020) urged scholars to investigate the willingness of society to accept E-voting before implementing it. Based on our limited knowledge, this paper is one of the pioneer papers focusing on the intention to use E-voting system in Malaysia. Therefore, the current findings add to a growing body of literature on E-voting. The investigation of E-voting intention undertaken here has extended our knowledge of the Technology Acceptance Model which explains the individual’s acceptance and adoption of the use of new technology. This study further extends existing knowledge on technology adoption models through combining possible constructs among Generation X in Malaysia.
While Coronavirus disease 2019 (COVID-19) is spreading around the world currently (2020) and many governments have decided to lockdown cities or entire countries, some are facing challenges in the conduct of elections during this critical period. Thus, this paper could offer some insights into understanding E-voting and to explore its applicability as one of the remedies of elections issues. As with all research, this paper has its limitations. There are a few limitations that calls for further research, for example low response rates. Additionally, it would be interesting to assess the perceptions of senior citizens towards E-voting, as some of them might face challenges with the internet and electronic devices. Nonetheless, since senior citizens also have voting rights, this paper recommends that in future studies, this group should be investigated as they might be one of the key factors to determine the success of E-voting.
The evidence from this study could be a key reference for the Election Commission, E-voting system developers and the government in implementation of the E-voting system in Malaysia. This paper also has a few implications for policymaking. By referring to findings in this paper, the implementation of E-voting may increase voter turnout. E-voting might also be beneficial to electoral administration. Our findings suggest that E-voting is preferable over conventional voting and call for use of new technology in voting. Lastly, another merit of this study is that E-voting offers an alternative to special voter groups, especially among people with restricted mobility, military personnel stationed overseas, students, citizens and expatriates residing and working overseas.
References
- Abu-Shanab, E. (2014). Antecedents of trust in e-government services: An empirical test in Jordan. Transforming Government: People, Process and Policy, 8(4), 480-499.
- Adeshina, S. A., & Ojo, A. (2014, September). Design imperatives for E-voting as a sociotechnical system. In 2014 11th International Conference on Electronics, Computer and Computation (ICECCO), (pp. 1-4). IEEE.
- Alomari, M. K. (2014). Discovering citizen’s reaction toward e-government: factors in e-government adoption. JISTEM-Journal of Information Systems and Technology Management, 11(1), 5-20.
- Alomari, M. K. (2016). E-voting adoption in a developing country. Transforming Government: People, Process and Policy, 10(4), 526-547.
- Alomari, M., Woods, P., & Sandhu, K. (2012). Predictors for e-government adoption in Jordan: Deployment of an empirical based on a citizen-centric approach. Information Technology & People, 25(2), 207-234.
- Alvarez, R. M., Hall, T. E., & Trechsel, A. H. (2009). Internet voting in comparative perspective: the case of Estonia. PS: Political Science & Politics, 42(3), 497-505.
- Alzahrani, A., Stahl, B. C., & Prior, M. (2012). Developing an instrument for e-public services’ acceptance using confirmatory factor analysis: Middle East context. Journal of Organizational and End User Computing (JOEUC), 24(3), 18-44.
- Barber, B. (1984). Strong democracy. Berkeley: University of California Press
- Carter, L., & Bélanger, F. (2005). The utilization of e‐government services: citizen trust, innovation and acceptance factors. Information systems journal, 15(1), 5-25
- Christian Schaupp, L., & Carter, L. (2005). E-voting: From apathy to adoption. Journal of Enterprise Information Management, 18(5), 586-601.
- Chin, W. W., Gopal, A., & Salisbury, W. D. (1997). Advancing the theory of adaptive structuration: The development of a scale to measure faithfulness of appropriation. Information systems research, 8(4), 342-367.
- Dahl, R. A. (1971). Polyarchy. New Haven, CT: Yale University Press.
- Davis, F.D. (1989). “Perceived Usefulness, Perceived Ease of Use, and User Acceptance of Information Technology”. MIS Quarterly, 13(3), pp.319-40.
- Driscoll, J. W. (1978). Trust and participation in organizational decision making as predictors of satisfaction. Academy of Management Journal, 21(1), 44-56.
- Elewa, A. E., AlSammak, A., AbdElRahman, A., & ElShishtawy, T. (2015). Challenges of electronic voting-a survey. Advances in Computer Science: An International Journal, 4(6), 98-108.
- Fakhoury, R., & Aubert, B. (2015). Citizenship, trust, and behavioural intentions to use public e-services: The case of Lebanon. International Journal of Information Management, 35(3), 346-351.
- Fitzgerald, J., & Wolak, J. (2016). The roots of trust in local government in western Europe. International Political Science Review, 37(1), 130-146.
- Germann, M., & Serdült, U. (2017). Internet voting and turnout: Evidence from Switzerland. Electoral Studies, 47, 1-12.
- Gilbert, D., Balestrini, P., & Littleboy, D. (2004). Barriers and benefits in the adoption of E-government. The International Journal of Public Sector Management, 17(4/5), 286.
- Gritzalis, D. A. (2002). Principles and requirements for a secure E-voting system. Computers & Security, 21(6), 539-556.
- Hair, J. F, Black, W. C., Babin, B. J., & Anderson, R. R. (2010). Multivariate data analysis. Prentice-Hall, Upper Saddle River, NJ.
- Hung, S. Y., Chang, C. M., & Yu, T. J. (2006). Determinants of user acceptance of the e-Government services: The case of online tax filing and payment system. Government Information Quarterly, 23(1), 97-122.
- Kim, S., & Lee, J. (2012). E‐participation, transparency, and trust in local government. Public Administration Review, 72(6), 819-828.
- Martin, B., Stewart, D., and Hillison, J. (2001) Computer Anxiety Levels of Virginia Extension Personnel. Journal of Extension, 39:1.
- Miller, A. H., & Listhaug, O. (1990). Political parties and confidence in government: A comparison of Norway, Sweden and the United States. British Journal of Political Science, 20(3), 357-386.
- Powell, A., Williams, C. K., Bock, D. B., Doellman, T., & Allen, J. (2012). E-voting intent: A comparison of young and elderly voters. Government Information Quarterly, 29(3), 361-372.
- Rana, N. P., Dwivedi, Y. K., & Williams, M. D. (2015). A meta-analysis of existing research on citizen adoption of e-government. Information Systems Frontiers, 17(3), 547-563.
- Rahman, S. (2018). Was It a Malay Tsunami? Deconstructing the Malay Vote in Malaysia’s 2018 Election. The Round Table, 1-14.
- Rogers, E. M. (1995). Diffusion of Innovations: modifications of a model for telecommunications. In Die diffusion von innovationen in der telekommunikation (pp. 25-38). Springer, Berlin, Heidelberg. Saifuddin: E-voting only for PKR elections, no more paper ballots Read more at https://www.thestar.com.my/news/nation/2018/07/07/saifuddin-evoting-only-for-pkr-elections-no-more-paper-ballots/#UJszS821PPoW2s02.99
- Schaupp, L.C. & Carter, L. (2005). “E-voting: from apathy to adoption,” The Journal of Enterprise Information Management Science, 18(5), pp.586-601.
- Sheranova, A. (2020). Cheating the Machine: E-voting Practices in Kyrgyzstan’s Local Elections. European Review, 1-17.
- Singh, S. (2015). EC chief gives E-voting the thumbs down Read more at https://www.thestar.com.my/news/nation/2015/09/25/ec-chief-gives-evoting-the-thumbs-down-abdul-aziz-we-will-stick-to-current-system-by-sarban-singh-sa/#AaQc3d1VPGkjkt1T.99
- Song, C., & Lee, J. (2016). Citizens’ use of social media in government, perceived transparency, and trust in government. Public Performance & Management Review, 39(2), 430-453
- Tan, C.C., and Tay, C. (2018). Overseas voters race against time to get votes home. http://www.theedgemarkets.com/article/overseas-voters-race-against-time-get-votes-home “Traffic volume higher than usual on highways in Malaysia ahead of election”, 2018. http://www.nationmultimedia.com/detail/breakingnews/30344870
- Warkentin, M., Sharma, S., Gefen, D., Rose, G. M., & Pavlou, P. (2018). Social identity and trust in internet-based voting adoption. Government Information Quarterly, 35(2), 195-209.
- Zhafry, M., & Kiesha, O. (2017). The economics of public holidays. Staff Insights 2017/9 Bank Negara Malaysia, http://www.bnm.gov.my/index.php?ch=en_ publication&pg=en_papers&ac=43&bb=file
- Zucco Jr, C., & Nicolau, J. M. (2016). Trading old errors for new errors? The impact of electronic voting technology on party label votes in Brazil. Electoral Studies, 43, 10-20.